Scaling CO₂ economies via ports
Fragmented CO₂ transport infrastructure promotes siloed thinking and duplicate assets across Europe, just like the LNG industry wasted billions until it found out that hubs are the way out.
Every energy transition has a molecule problem. In the 1950s it was LNG; now it’s CCS. The LNG industry wasted decades building bespoke infrastructure before discovering that shared hubs were the answer. Europe’s CCS market risks repeating the same expensive mistakes.
Port-based multi-user hubs solve most carbon management challenges at once: they aggregate volumes from dozens of emitters into shared compression, buffer storage, and loading jetties; unlock economies of scale that individual projects cannot achieve alone; smooth seasonal swings and deliver the cargo sizes and schedules storage operators need; share permitting, safety, monitoring, and modular costs across many customers; create coherent transport options; and establish landing points for future merchant ships with onboard carbon capture.
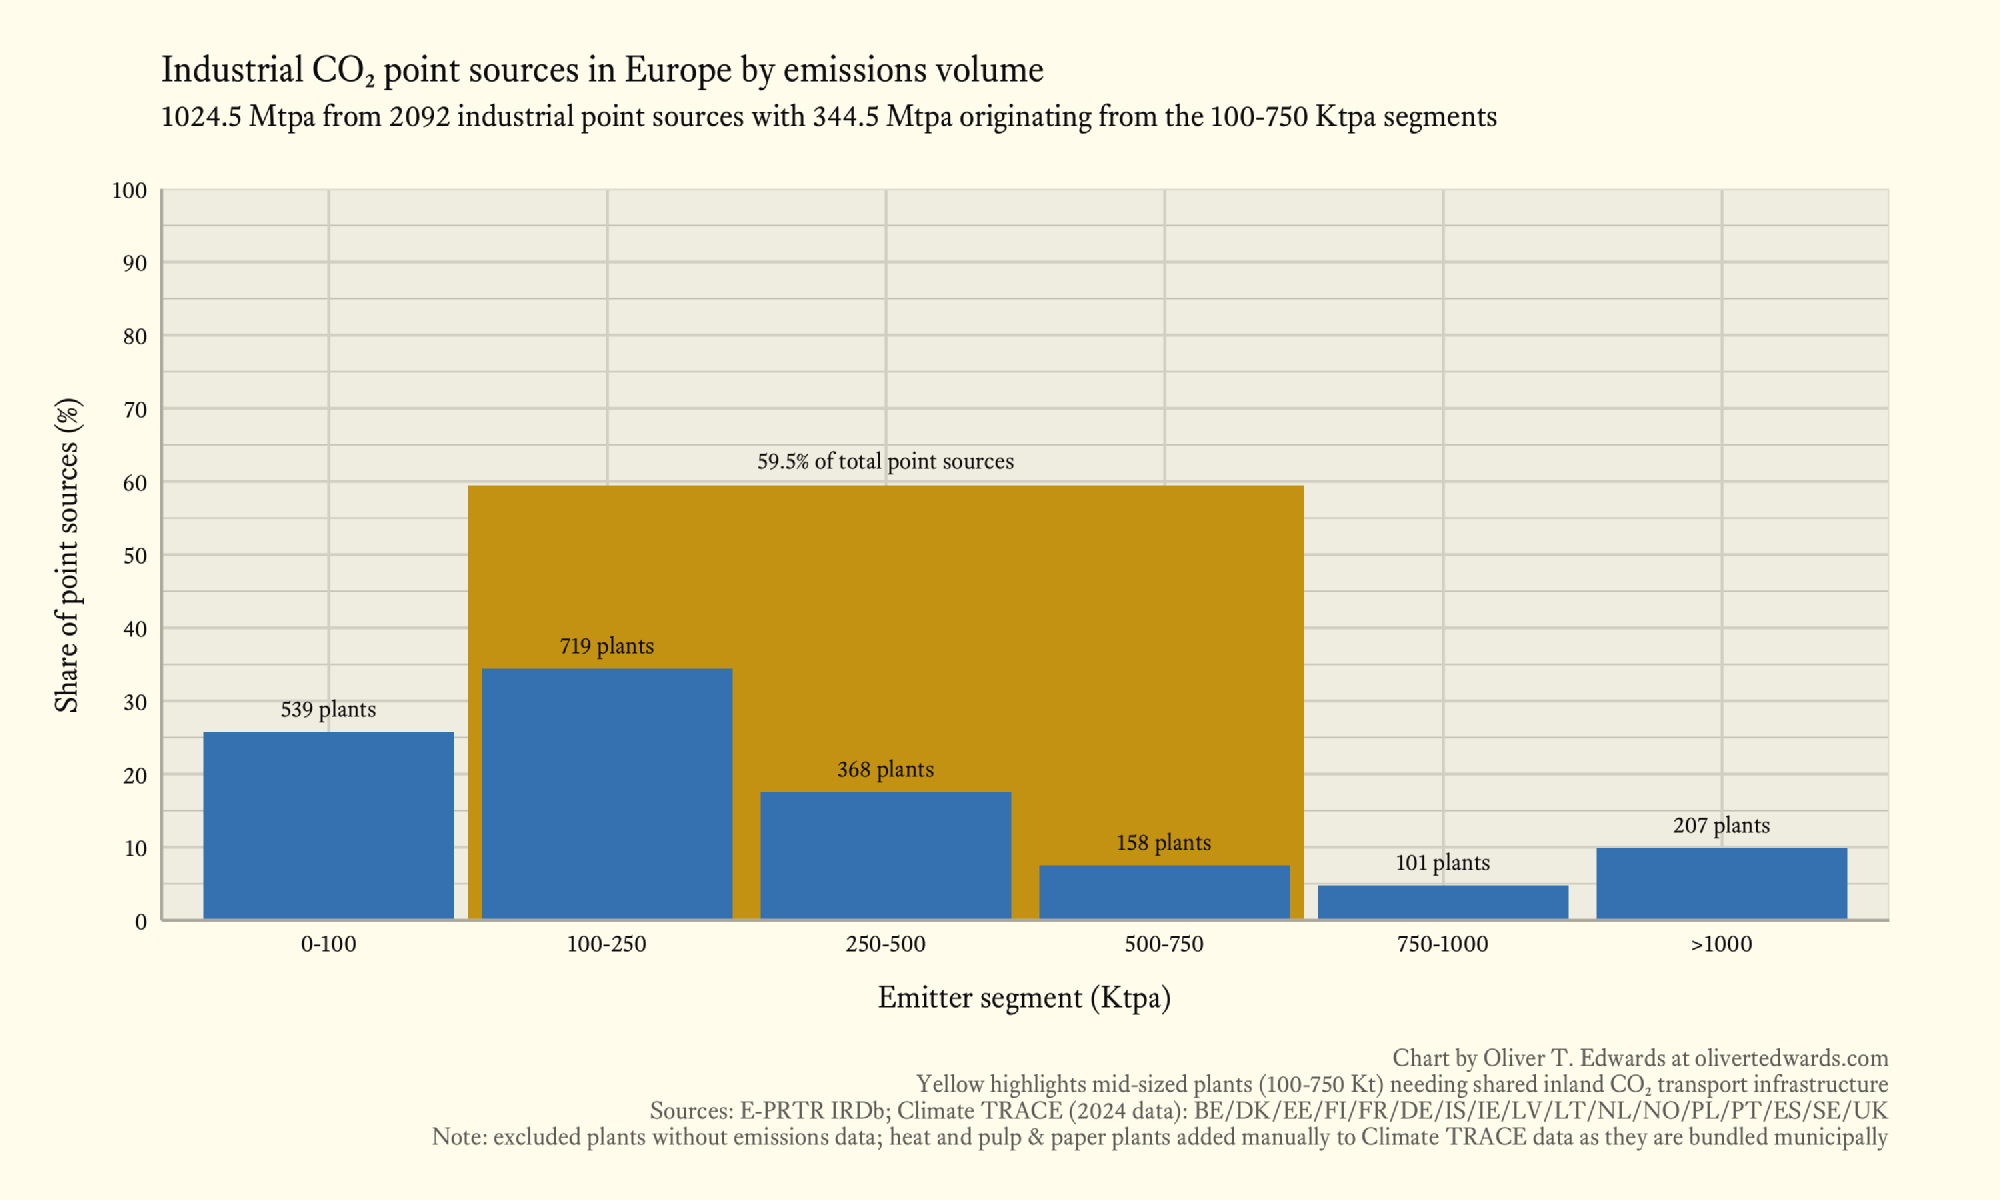
Roughly 60% of Europe’s industrial CO₂ point sources are mid-sized emitters (100–750 ktpa), representing a third of regional emissions. Current flagship transport and storage solutions prioritise high-volume, high-purity streams, leaving these mid-sized emitters (the majority by count) struggling to connect. The LNG industry took thirty years and billions in stranded assets to learn that shared hubs are the way out. We have maybe ten.
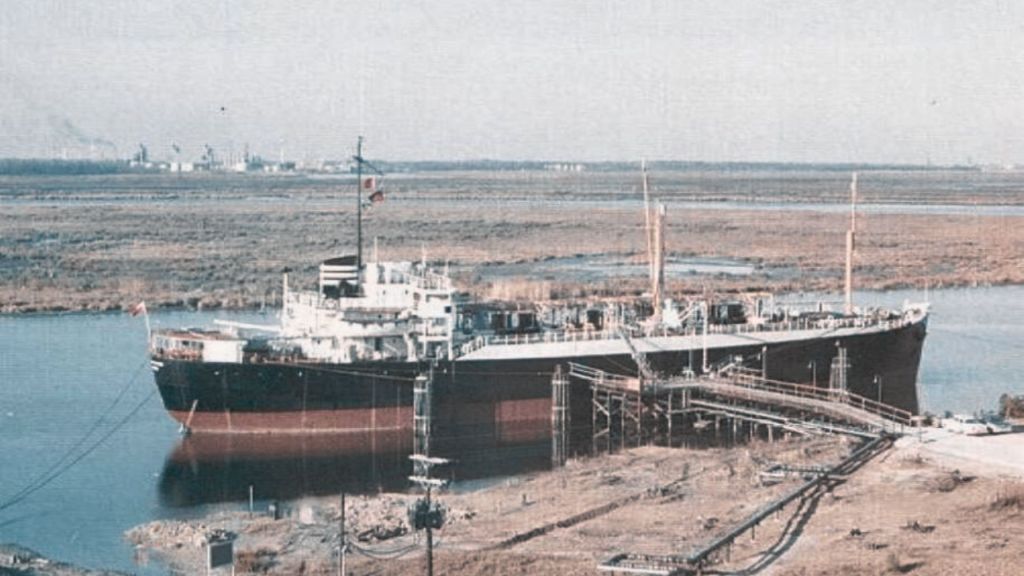
In the 1950s, the global LNG 1 market began shaping up as producers raced to provide energy security in the wake of World War II. 2 Everyone was building bespoke infrastructure. One of the most famous ventures was Constock International Methane, a joint venture between Continental Oil and Union Stock Yards, which launched the world’s first LNG carrier, the Methane Pioneer (1959), shipping gas from Louisiana to the United Kingdom (Stopford2008, pp.484)x. It was a triumph of engineering, but a bit of a commercial disaster. LNG costs stayed punishingly high for decades because every project duplicated the same expensive assets: dedicated ships, dedicated terminals, dedicated regasification plants. 3
The turning point came when the industry stopped building everything bespoke and started pooling cargo volumes through shared hubs. 4 Once multiple producers and consumers were routing through the same terminals, compression facilities, and loading infrastructure, per-tonne transport costs fell by an order of magnitude 5 or more. Economies of scale 6 turned LNG from an expensive curiosity into a commodity cheap enough to displace coal and oil worldwide.
Lessons from LNG
Innovations do not create change. That is rare. Innovations succeed by exploiting change, not attempting to force it.
Peter Drucker
The CCS 7 market today looks remarkably like LNG in the 1950s. I’ve reviewed a number of proposals from emitters designing their own terminals and ships. Many look sound on paper until you consider how their strategies for interfacing with the rest of the value chain compound the same scale inefficiencies that kept LNG unaffordable for a generation.
Scaling via ports
If LNG’s history teaches anything, it’s that the unit economics of molecule transport only work at scale, and scale requires sharing. Port-based multi-user hubs are the mechanism that makes sharing possible for CO₂, just as they made it possible for natural gas.
Nearly all proven CO₂ storage capacity is clustered around the North Sea, and onshore storage continues to face public resistance almost everywhere. For the time being, every emitter—coastal or inland, large or small—needs reliable, affordable access to a port. Long distances and modest individual volumes make bundling essential. Storage operators demand minimum cargo sizes and stable delivery schedules. Seasonal variations (especially bioenergy and waste-to-energy low seasons) create volume swings that pose serious economic risk without adequate hub storage buffering.
Here is what shared hubs actually solve:
- Aggregating volumes lowers costs. Collecting CO₂ from many emitters and routing it to shared compression, intermittent storage, and loading jetties unlocks economies of scale that individual projects cannot achieve on their own. Shared infrastructure avoids the capex duplication that defined early LNG, where bespoke builds stranded billions.
- Logistics become reliable. Hubs directly connect all transport modes from inland capture to offshore storage, acting as critical transfer points—much like distribution centres in the postal system. This replaces the fragmented networks that currently leave mid-sized emitters guessing how to move their CO₂.
- Early projects are de-risked. Sharing permitting, safety regimes, monitoring, and modular capex across dozens of customers and offtake services means no emitter has to navigate regulations alone. In LNG hubs, this kind of pooling cut per-unit risk by 20–40%.
- Maritime decarbonisation advances in parallel. Hubs create natural offloading points for ships equipped with onboard carbon capture and storage (OCCS) systems, strengthening the carbon market without requiring separate infrastructure.
- The CO₂ economy gets a foundation. Large hubs can support utilisation facilities, enabling the shift from pure storage to production of green fuels and chemicals. Multiple ports spread risk, balance volumes across seasons and regions, and prevent single-point congestion failures.
These are the elements that turned LNG from an expensive novelty into a global commodity. They are just as realistic a path for CO₂.
Compounded fragmentation problems
Current CO₂ transport and storage providers have constraints that make CCS inaccessible for roughly 60% of emitters. 8 Flagship solutions like Northern Lights 9 prioritise high-volume, high-purity streams to de-risk early operations; sensible so and I’m not calling them out. But this still leaves most of Europe’s small and mid-sized industrial point sources without affordable ways to connect. I’ve spoken to many of them and know their headaches.
Some aim to build their own quays to enable collection by ship, then add their own vessels. This is both impractical and uneconomical for a mid-sized plant, and it compounds risk across the value chain by adding maritime operations to what is already a specialised industrial process.
Many ports are already congested, which creates a need for larger ships that can batch-transport bundled volumes. Small and mid-sized emitters generally cannot afford those bigger, more expensive vessels. Meanwhile, the number of North Sea storage wells opting for ship-based injection is increasing, and FSIU vessels have limited loading and unloading capacity. Smaller vessels will create the same congestion at injection sites that they do at quays, reinforcing the need for larger carriers fed by aggregation hubs.
There are not many deep-sea ports, so smaller hubs and individual emitter loading quays do have a role, but for transhipment and bundling onto larger ships rather than direct-to-storage routes. Building intermittent storage facilities and tanks at every small port is prohibitively expensive. Bundling emitters regionally, as LNG eventually learned to do, avoids wasting capital on duplicated assets.
Shared inland transport networks are also essential, especially for mid-sized emitters who need to connect with regional distribution hubs and terminals. There is currently no purpose-built CO₂ distribution network; at least nothing comparable to the postal service or waste disposal system. Emitters often aren’t sure what the best option is for moving their CO₂ to where it needs to go. In these early market days, rail and trucking distribution terminals can help bridge the gap.
The cost structure of inland transport makes this concern rational. Global logistics costs by transport mode are roughly 75% trucking, 15% maritime, 5% air, and 5% rail (Rodrigue2024, ch. 7.4), and even as a rough average, that signals particular risk for emitters further inland. Inland distribution terminals operating like a postal service could help with coordination and economies of scale, but the near-term priority is railway and trucking terminals. Small to mid-sized emitters placed inland cannot afford to build a pipeline themselves. They need shared inland transport, preferably at sufficient scale to reduce volume fluctuation risks, improve commercial terms, average out capex, reduce operating costs, and bring overall prices down.
As for pipelines: they have long lead times, limited flexibility, and require serious land development and regulatory work, as I’ve noted in my post on land development for CO₂ hubs. Scoping a pipeline for future demand is also difficult because nobody knows how much capacity the CO₂ grid will need in twenty years, let alone fifty. Transitioning to green energy is desirable, but with Germany and many other countries doubling down on LNG gas grids for energy security, fossil fuels seem to remain a large part of the energy mix for years. If rising energy consumption drives higher growth and welfare, CO₂ emissions may keep growing, increasing the need for pipeline capacity. We will also need to build green energy infrastructure, which itself requires emissions up to a certain point. Careful planning is needed to scope, build, operate, and maintain a CO₂ pipeline grid for decades; and this means increasingly postponed implementation timelines, further increasing the relevance of ship and rail transport in the near and medium term.
Building bespoke infrastructure does not solve fragmentation. It risks compounding it; not just for mid-sized emitters, but across the entire value chain as complexity accumulates.
Emitter markets
Europe
The European emitter market underscores the fragmentation outlined above. Having assembled a dataset on industrial point sources and their mean distances to port and railway across Europe, I’ve examined the market segmented by small-sized (<100 ktpa), mid-sized (100–750 ktpa), large-sized (750–1000 ktpa), and massive-sized (>1000 ktpa) emitters across Belgium, Denmark, Estonia, Finland, France, Germany, Iceland, Ireland, Latvia, Lithuania, Netherlands, Norway, Poland, Portugal, Spain, Sweden, and the United Kingdom; with special attention on the Netherlands, Poland, and Sweden for their distinctly different geographic and infrastructural profiles.
The pattern is consistent: large emitters (>750 ktpa) typically have access to greater capital, allowing them to invest independently in CCS. Small (<100 ktpa) and mid-sized emitters are far more dependent on shared transport infrastructure and pooled resources.
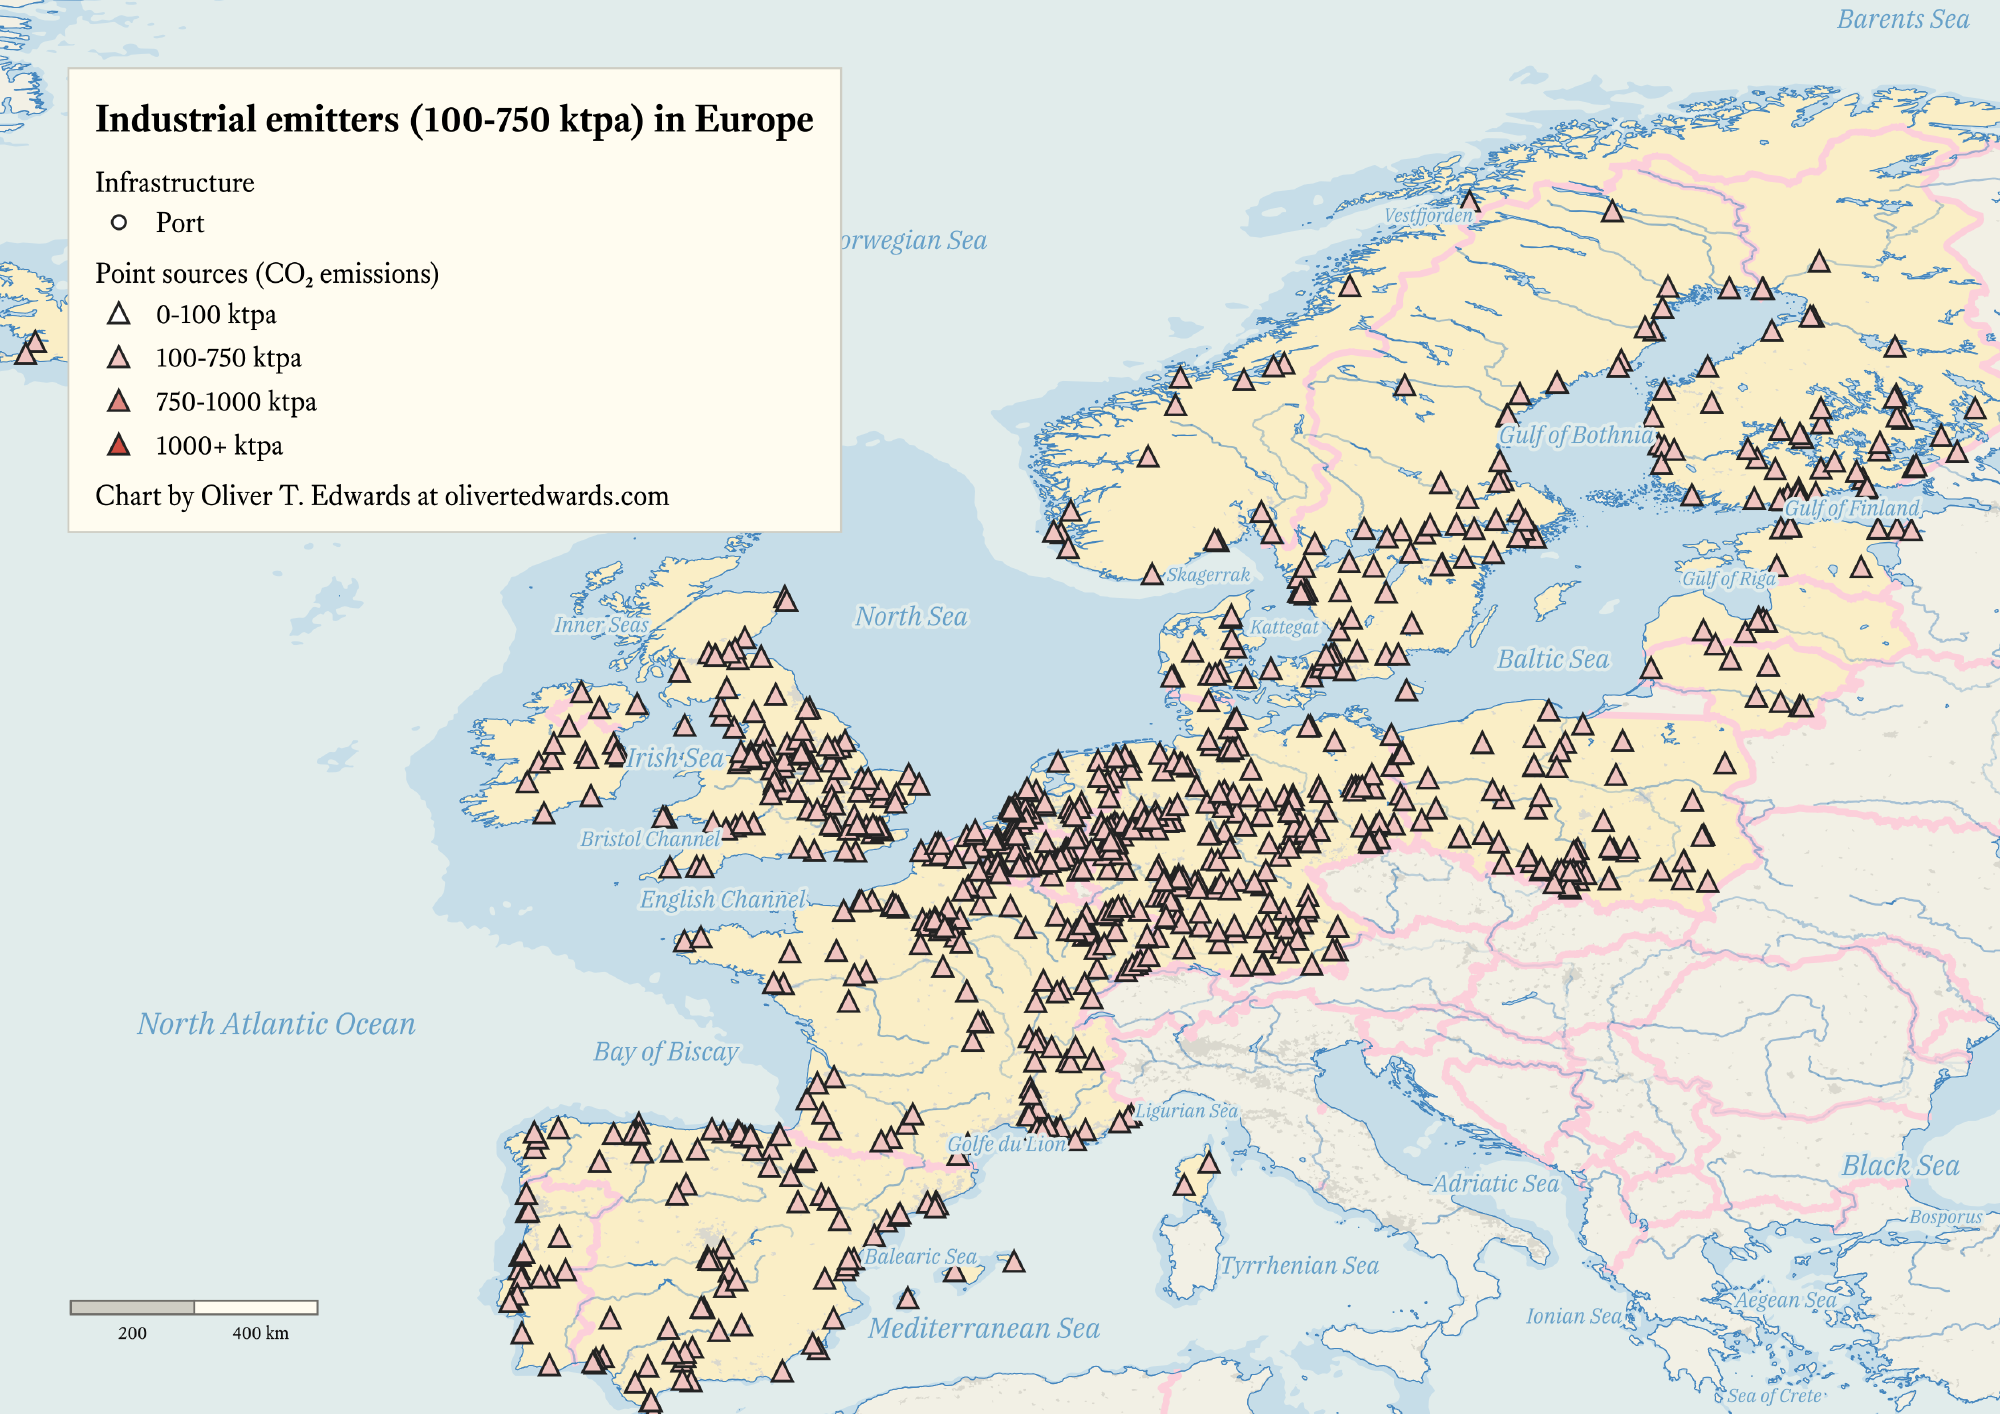
Aggregating CO₂ output from multiple small and mid-sized emitters will likely generate sufficient transport demand to justify shared infrastructure (rail or multi-user pipelines) especially in regions with high emitter density like the Netherlands or Poland’s Śląskie region. The prevalence of small and mid-sized emitters by number of plants, particularly in Sweden (pulp and paper) and the Netherlands (chemical plants), contrasts with Poland’s mix of large coal-based and smaller industrial emitters. Since offshore sites are the most prominent storage wells at this point, port access is critical: tonne-mile shipping costs are lower than any other mode, thanks to economy of scale. Onshore storage continues to meet regulatory hurdles and public opposition, increasing the importance of shipping.
On average, LNG shipping costs about €0.005–0.01 per tonne-mile and costs for CO₂ shipping are close to this figure, railway €0.05, and trucking €0.25 (ranges confirmed through dialogue with various national providers). CO₂ shipping costs must also account for the unique cooling and pressurisation requirements, which differ from LNG, and volatility due to fuel prices (Stopford2008, pp.35). Shipping cost is probably the most volatile component at this stage of the market.
59.5% of industrial CO₂ point sources fall in the mid-sized segment, accounting for roughly 33% of total regional emissions (344.5 of 1024.5 mtpa). 10
The top CO₂ emitting sectors within the mid-sized segment are waste to energy, natural gases, and other gases. Waste to energy and cement are the sectors most easily decarbonised, while natural gases and other gases represent emissions from a variety of processes including LNG terminals, where carbon capture is less straightforwardly implemented within the regional value chain.
| Sector | Emissions (Mtpa) | Share (%) of mid-sized segment |
|---|---|---|
| Waste to energy | 63.2 | 18 |
| Natural gases and other gases | 52.4 | 15 |
| Cement | 37.5 | 10 |
| Mid-sized segment total | 344.5 |
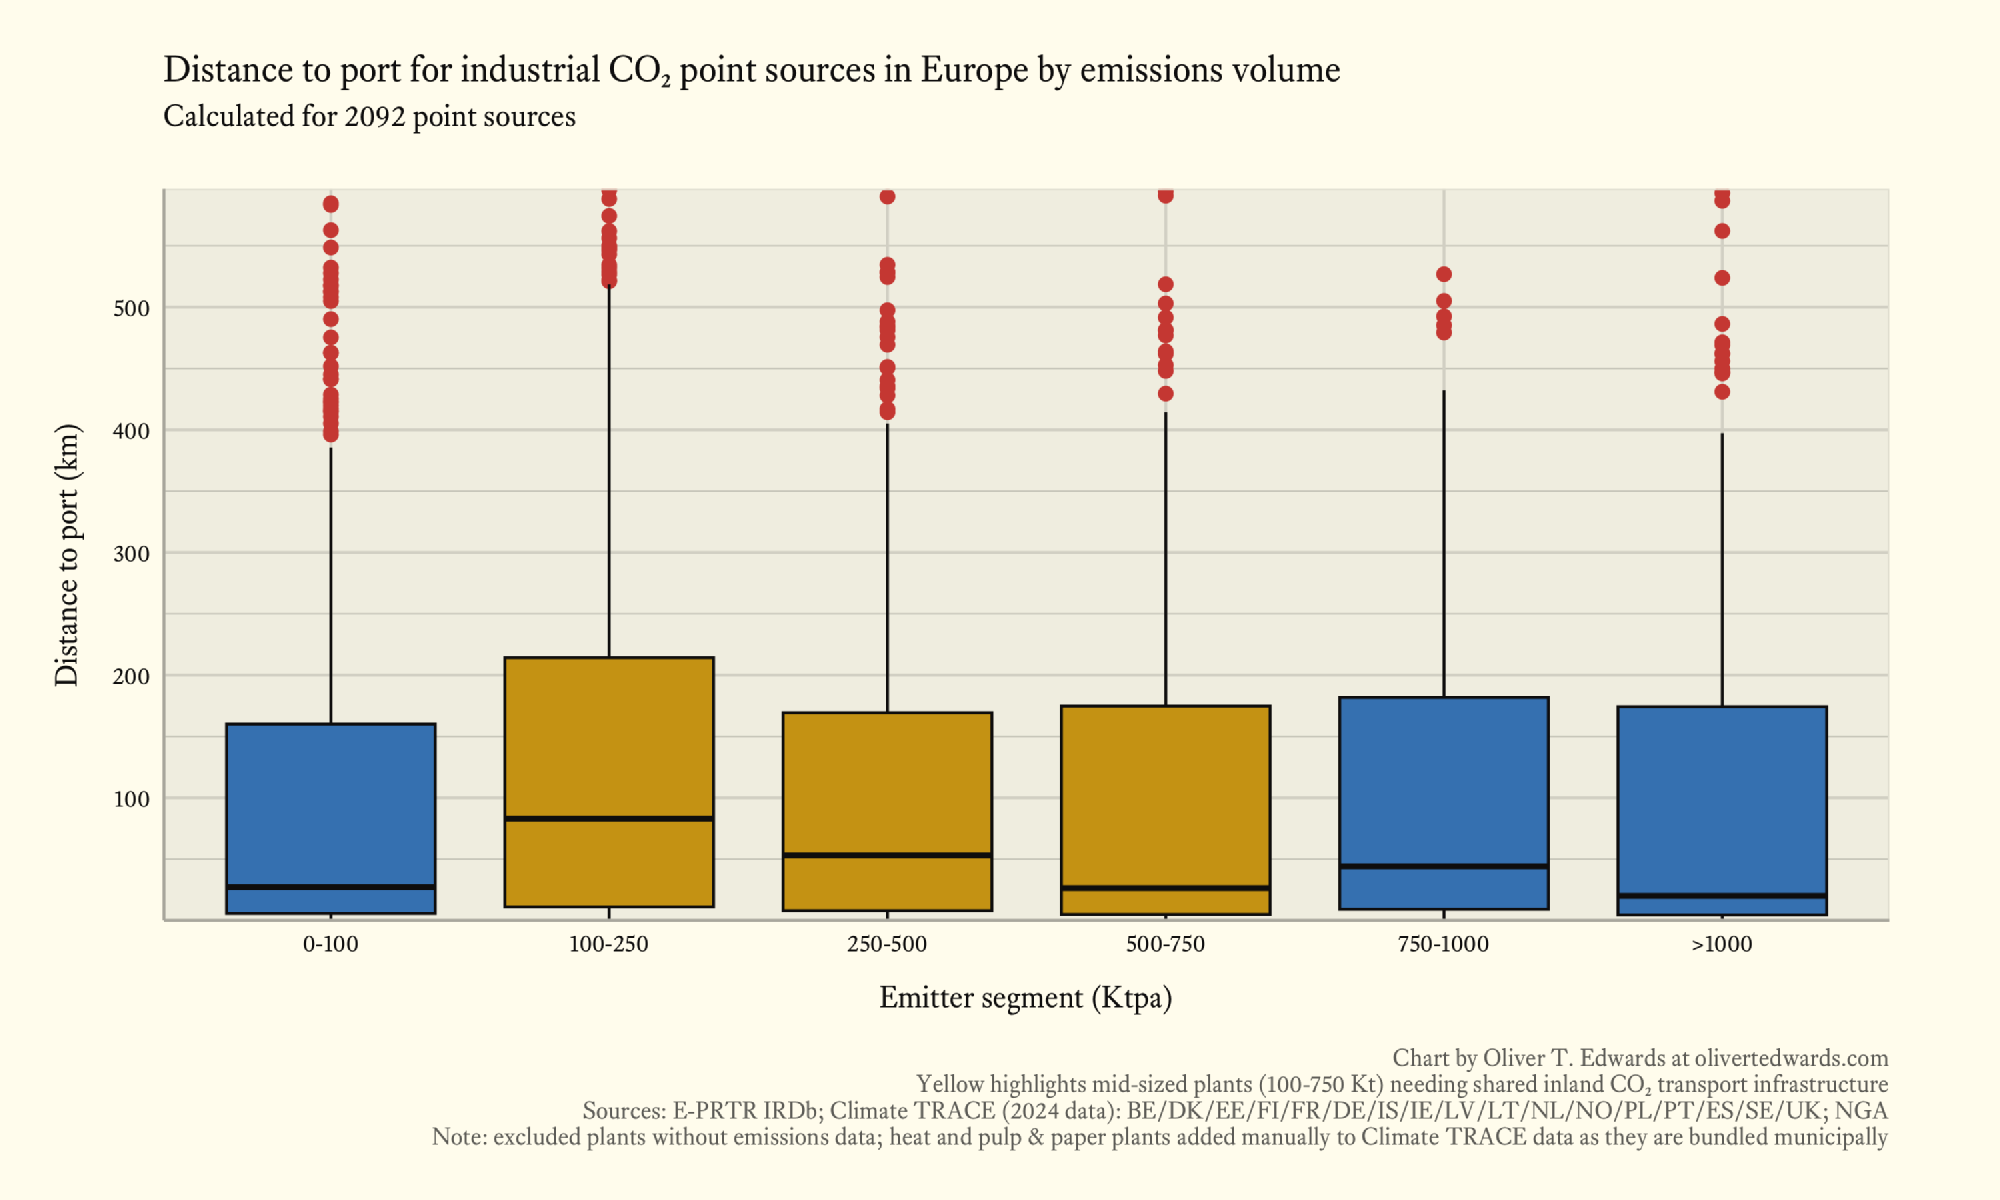
Across all segments, there is roughly a 200 km spread in point source distance to port between the lower quartile (around 1 km) and the upper quartile (around 210 km), reflecting the varied geographies and coastal access across the continent. Within the mid-sized segment specifically, mean distance to port decreases with scale: around 75 km for the 100–250 ktpa band, 50 km for 250–500 ktpa, and 25 km for 500–750 ktpa. Average distances vary significantly by country; Poland’s inland geography results in long port distances (to Gdańsk, primarily), while Sweden and the Netherlands benefit from shorter distances to coastal terminals. Small emitters, with limited financial resources, are disproportionately affected by long port distances, since shipping CO₂ to offshore North Sea storage requires costly transport solutions in the absence of shared infrastructure. There are also many outliers that will require tailored inland transport solutions, though each nation will have to address these separately. Shared port terminals or multi-modal hubs combining rail and shipping can lower barriers particularly for inland emitters, by connecting them to offshore storage.
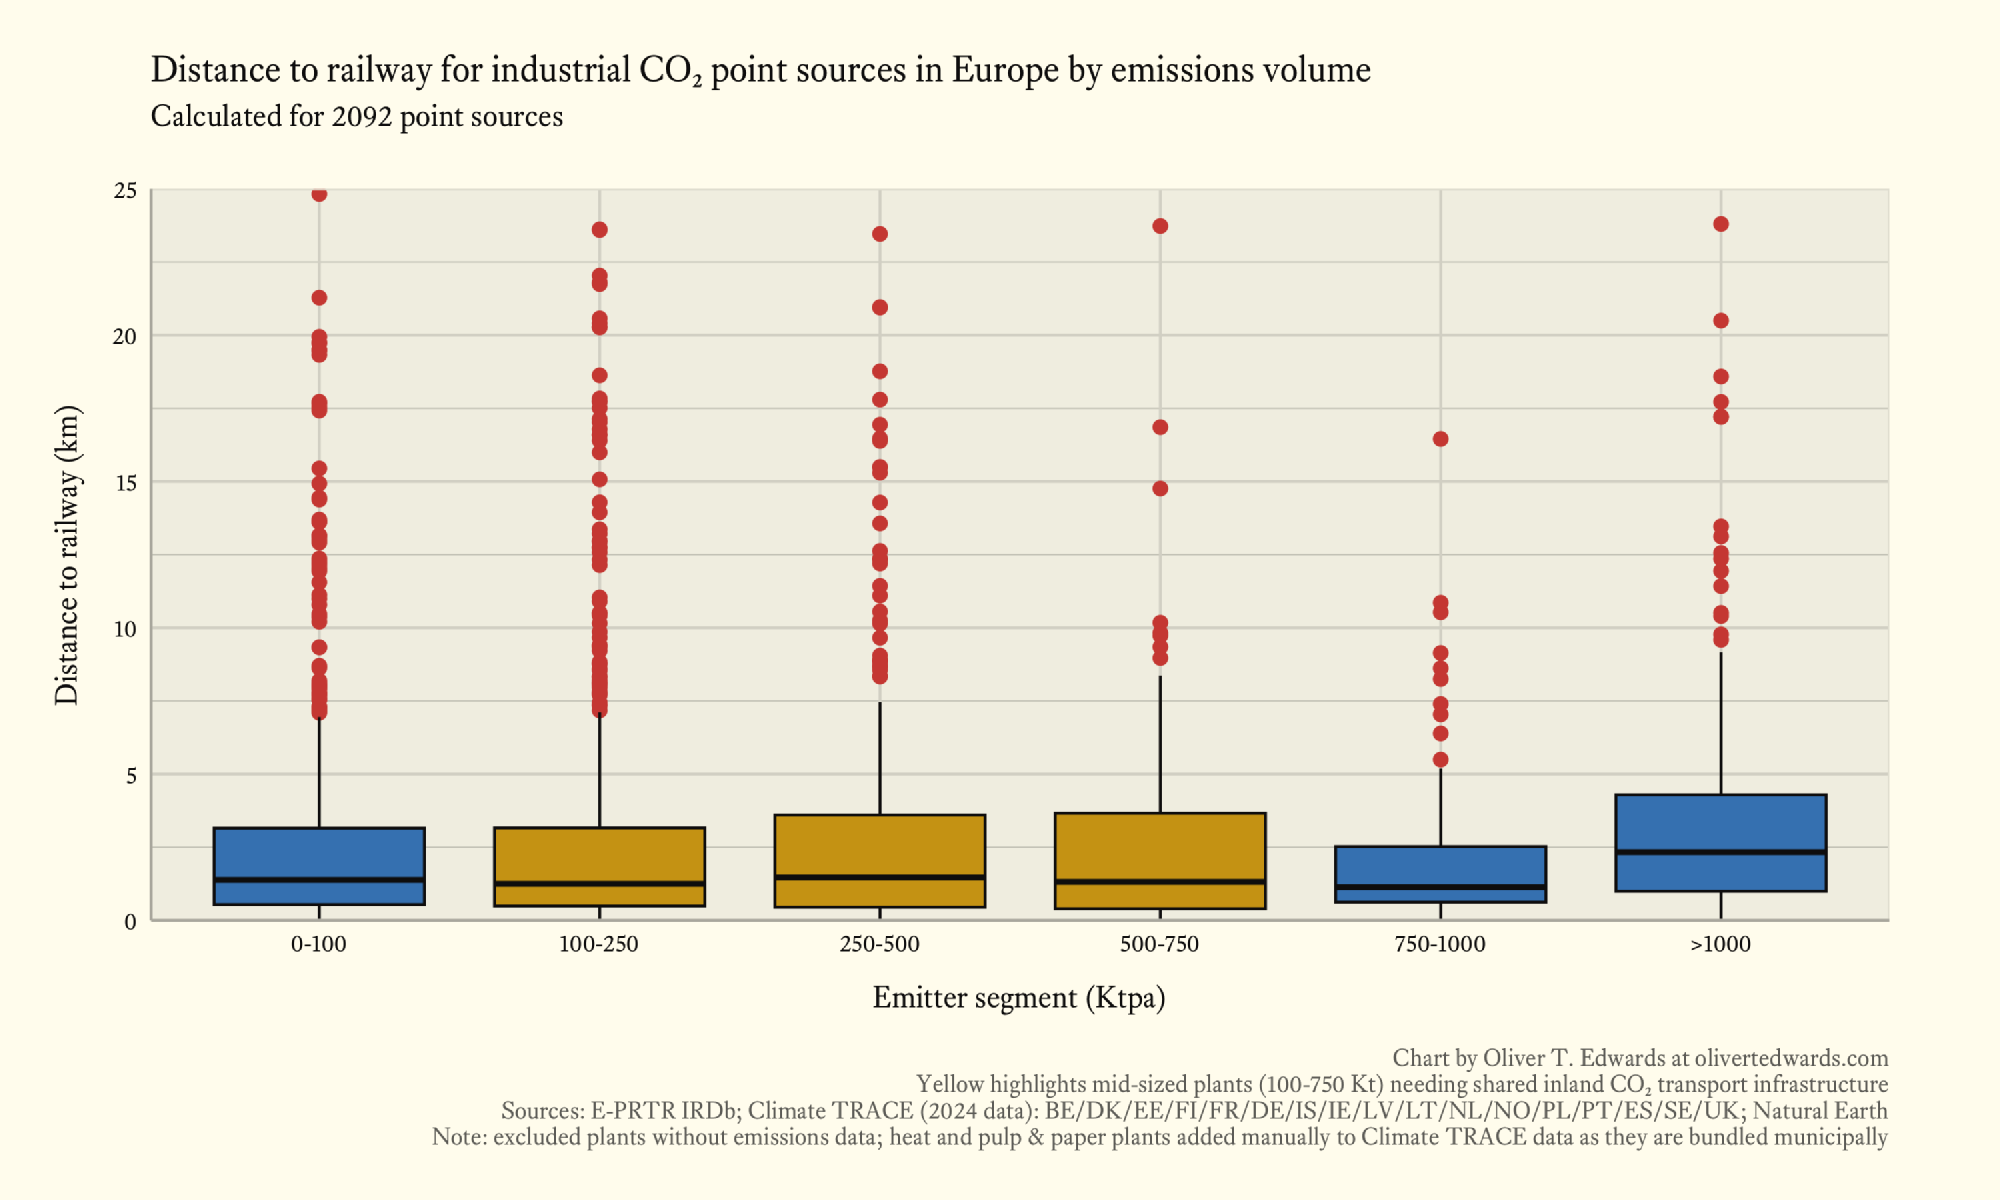
Across all segments, distances to the nearest railway are far shorter and more uniform: about a 3 km spread between the lower quartile (around 1 km) and the upper quartile (around 4 km), with mean distances stable in the 1–2 km range across all segments. This consistency is unsurprising given the statistical significance of distances computed across 2,092 point sources. Rail transport is often more cost-effective than pipelines for small-to-medium CO₂ volumes over medium distances, making it a key option for inland emitters, particularly in Poland and the Netherlands with their dense rail networks. Developing shared rail terminals or CO₂ collection hubs can lower transport costs for small emitters, enabling access to CCS networks; especially in Poland, where rail is critical due to long port distances. Short distance to railway matters most for emitters without direct port access.
The data provides a sense of scale for the fragmentation problem, showing the need for shared solutions like hubs to bridge inland gaps to offshore storage.
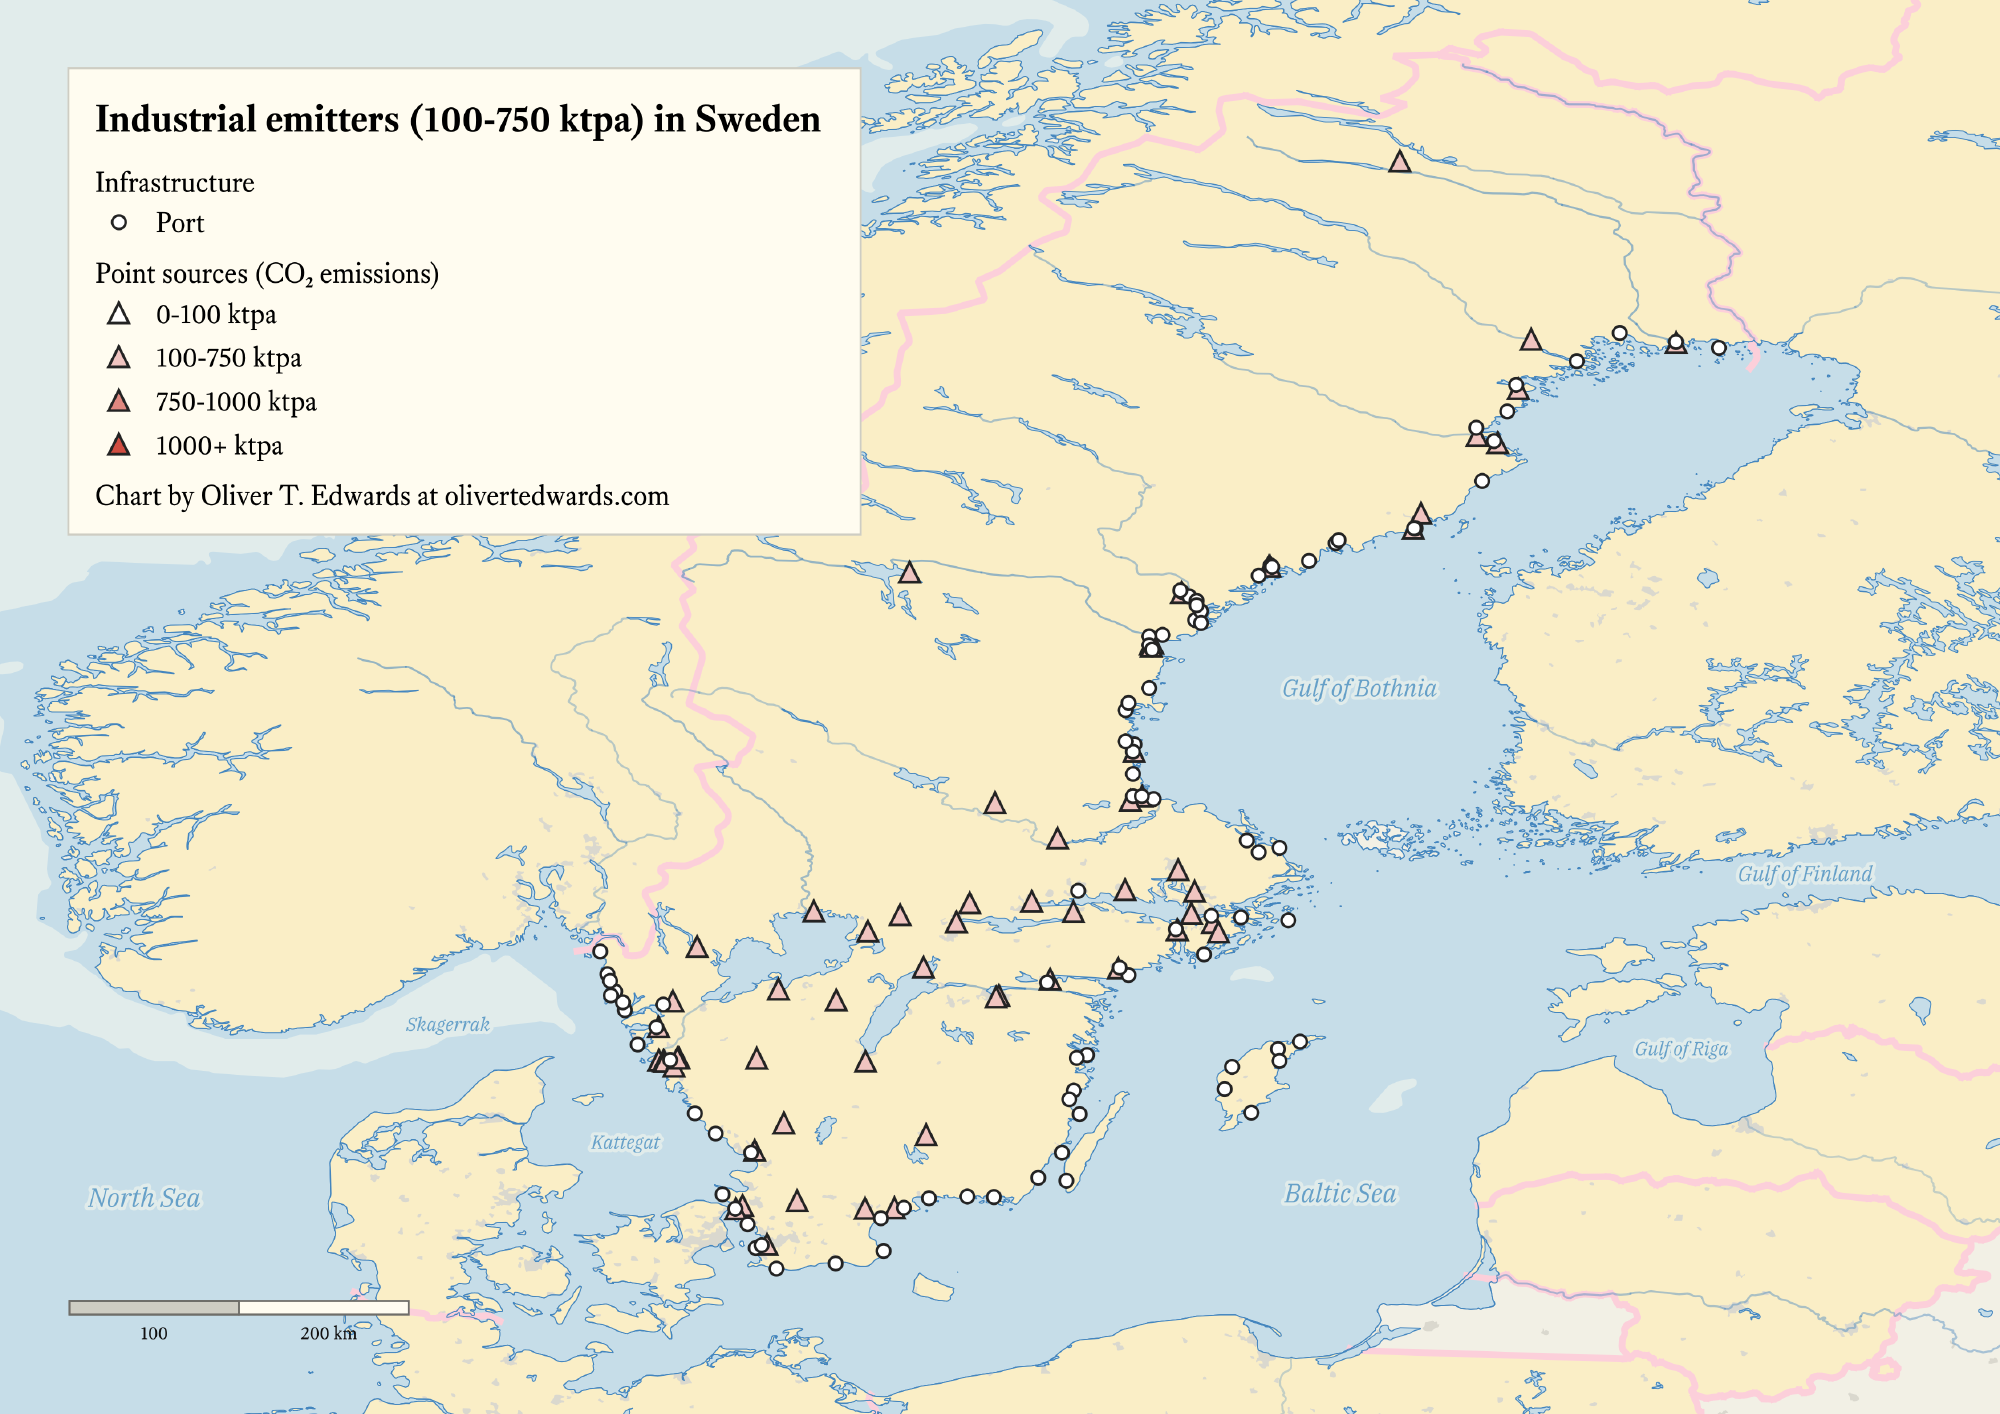
Sweden
In Sweden, an evenly distributed network of hubs is essential because emitters are spread across 1,500 km from north to south. Railways are particularly important in the southern hinterland where emitters are further inland, and that also means southern hubs might need larger buffer storage to account for greater seasonal variations when pooling cargo volumes. Building shared hubs and transport networks is especially important in Sweden given the overwhelmingly large market share of mid-sized emitters. This is the approach we’re taking at Normod Carbon to connect emitters efficiently.
73.8% of industrial CO₂ point sources fall in the mid-sized segment, accounting for 51% of total national emissions.
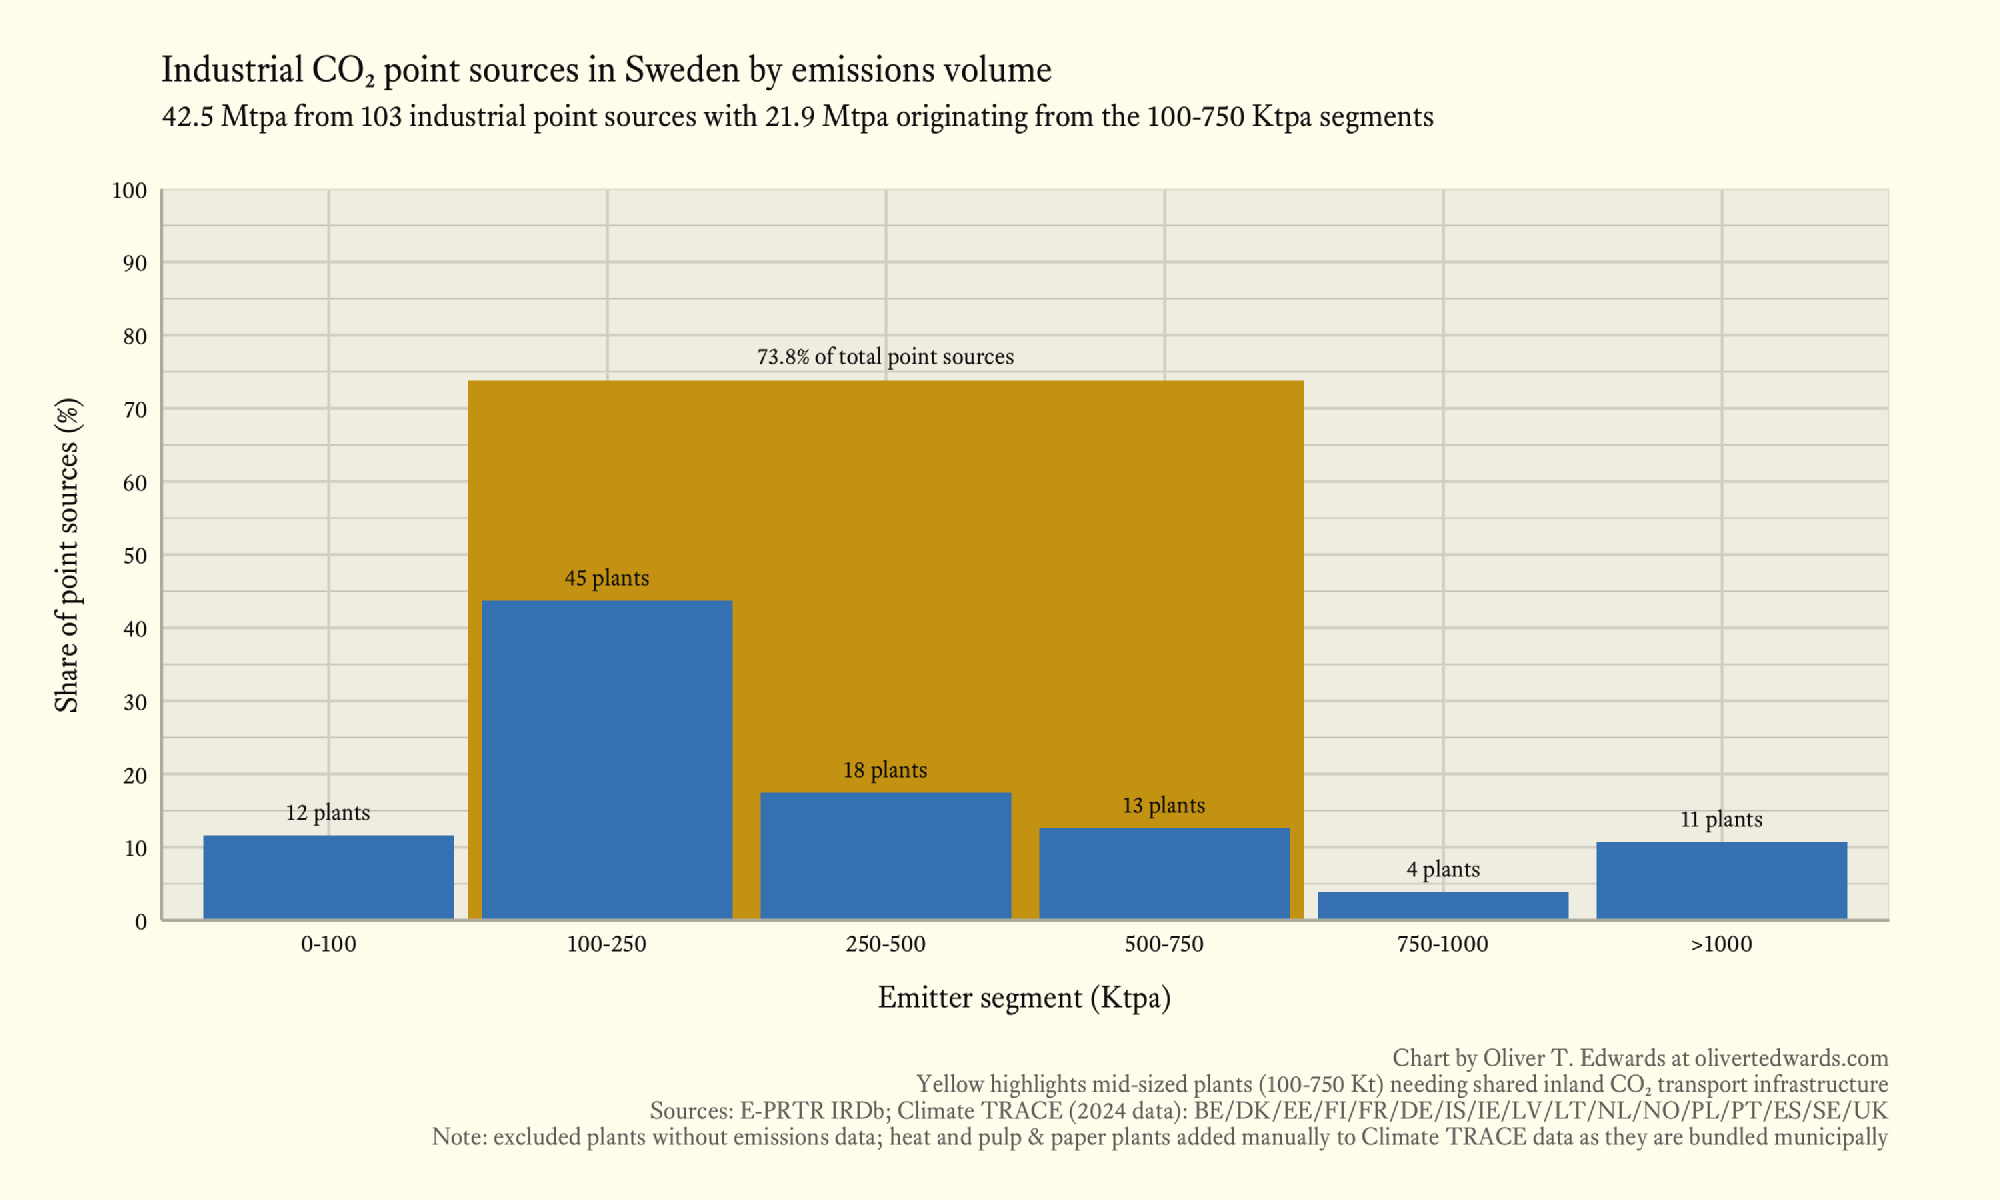
The top three CO₂ emitting sectors within the mid-sized segment are pulp and paper, biomass and bioenergy, and waste to energy. All three are rated as easily decarbonised sectors, making it technologically easier to decarbonise Swedish industry than in many other European countries. This should moderately ease the cost burden of implementing carbon capture for many companies.
| Sector | Emissions (Mtpa) | Share (%) of mid-sized segment |
|---|---|---|
| Pulp and paper | 9.2 | 42 |
| Biomass and bioenergy | 6.8 | 31 |
| Waste to energy | 3.7 | 16 |
| Mid-sized segment total | 21.9 |
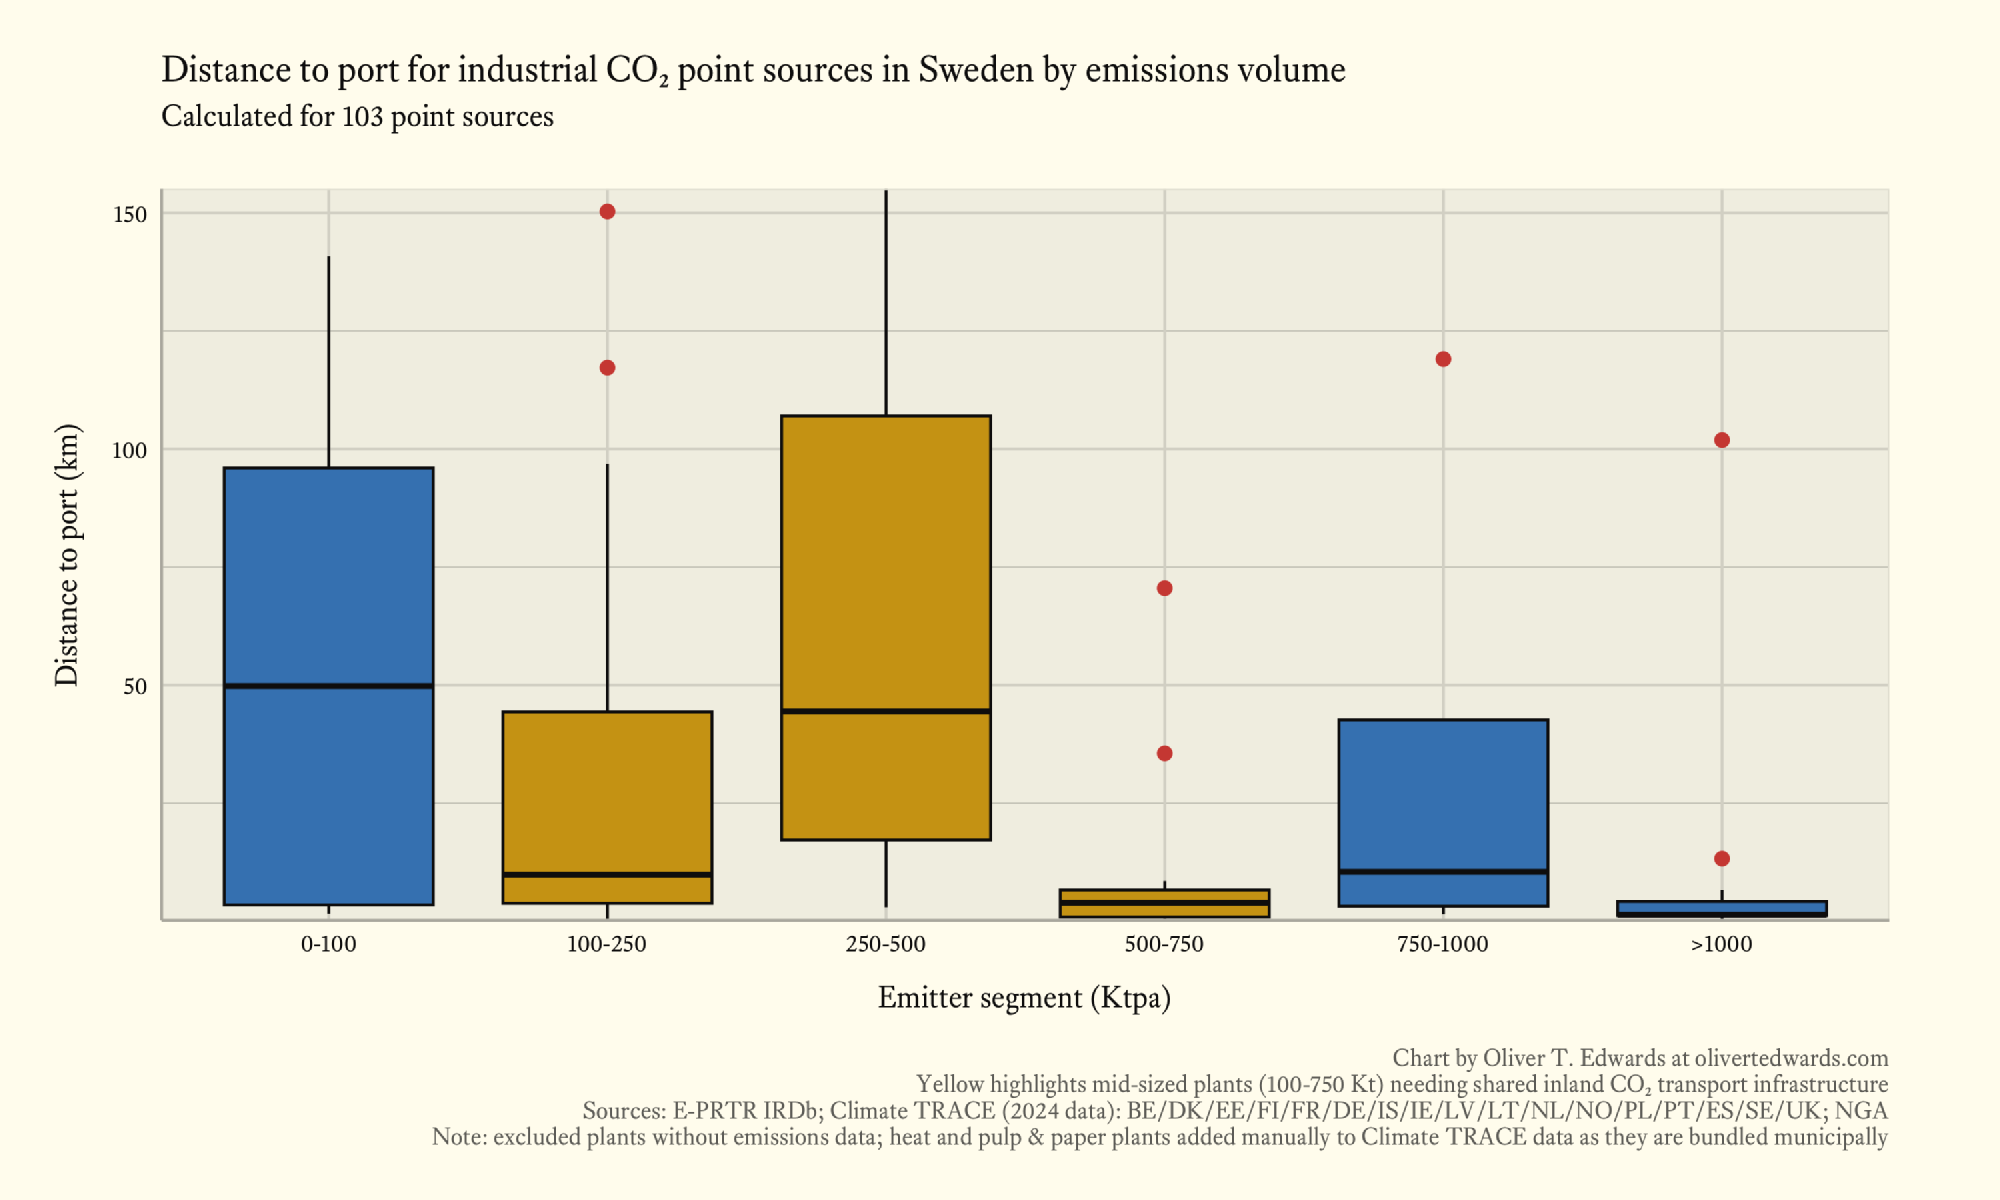
Across the mid-sized segment, mean distances from point source to nearest port range from 5–48 km, with a 104 km spread between the lower quartile (1 km) and the upper quartile (105 km). In general, emitters in the northern regions are located within close proximity to ports. The main issue for port accessibility lies in the southern regions, though many emitters there are within relatively close proximity to railways. Further inland towards Norway, there are a few outliers with exceptionally long distances to ports. However, most of the railway routes passing these sites are already outfitted for heavy industrial use, which is a positive sign for serving outliers in the market.
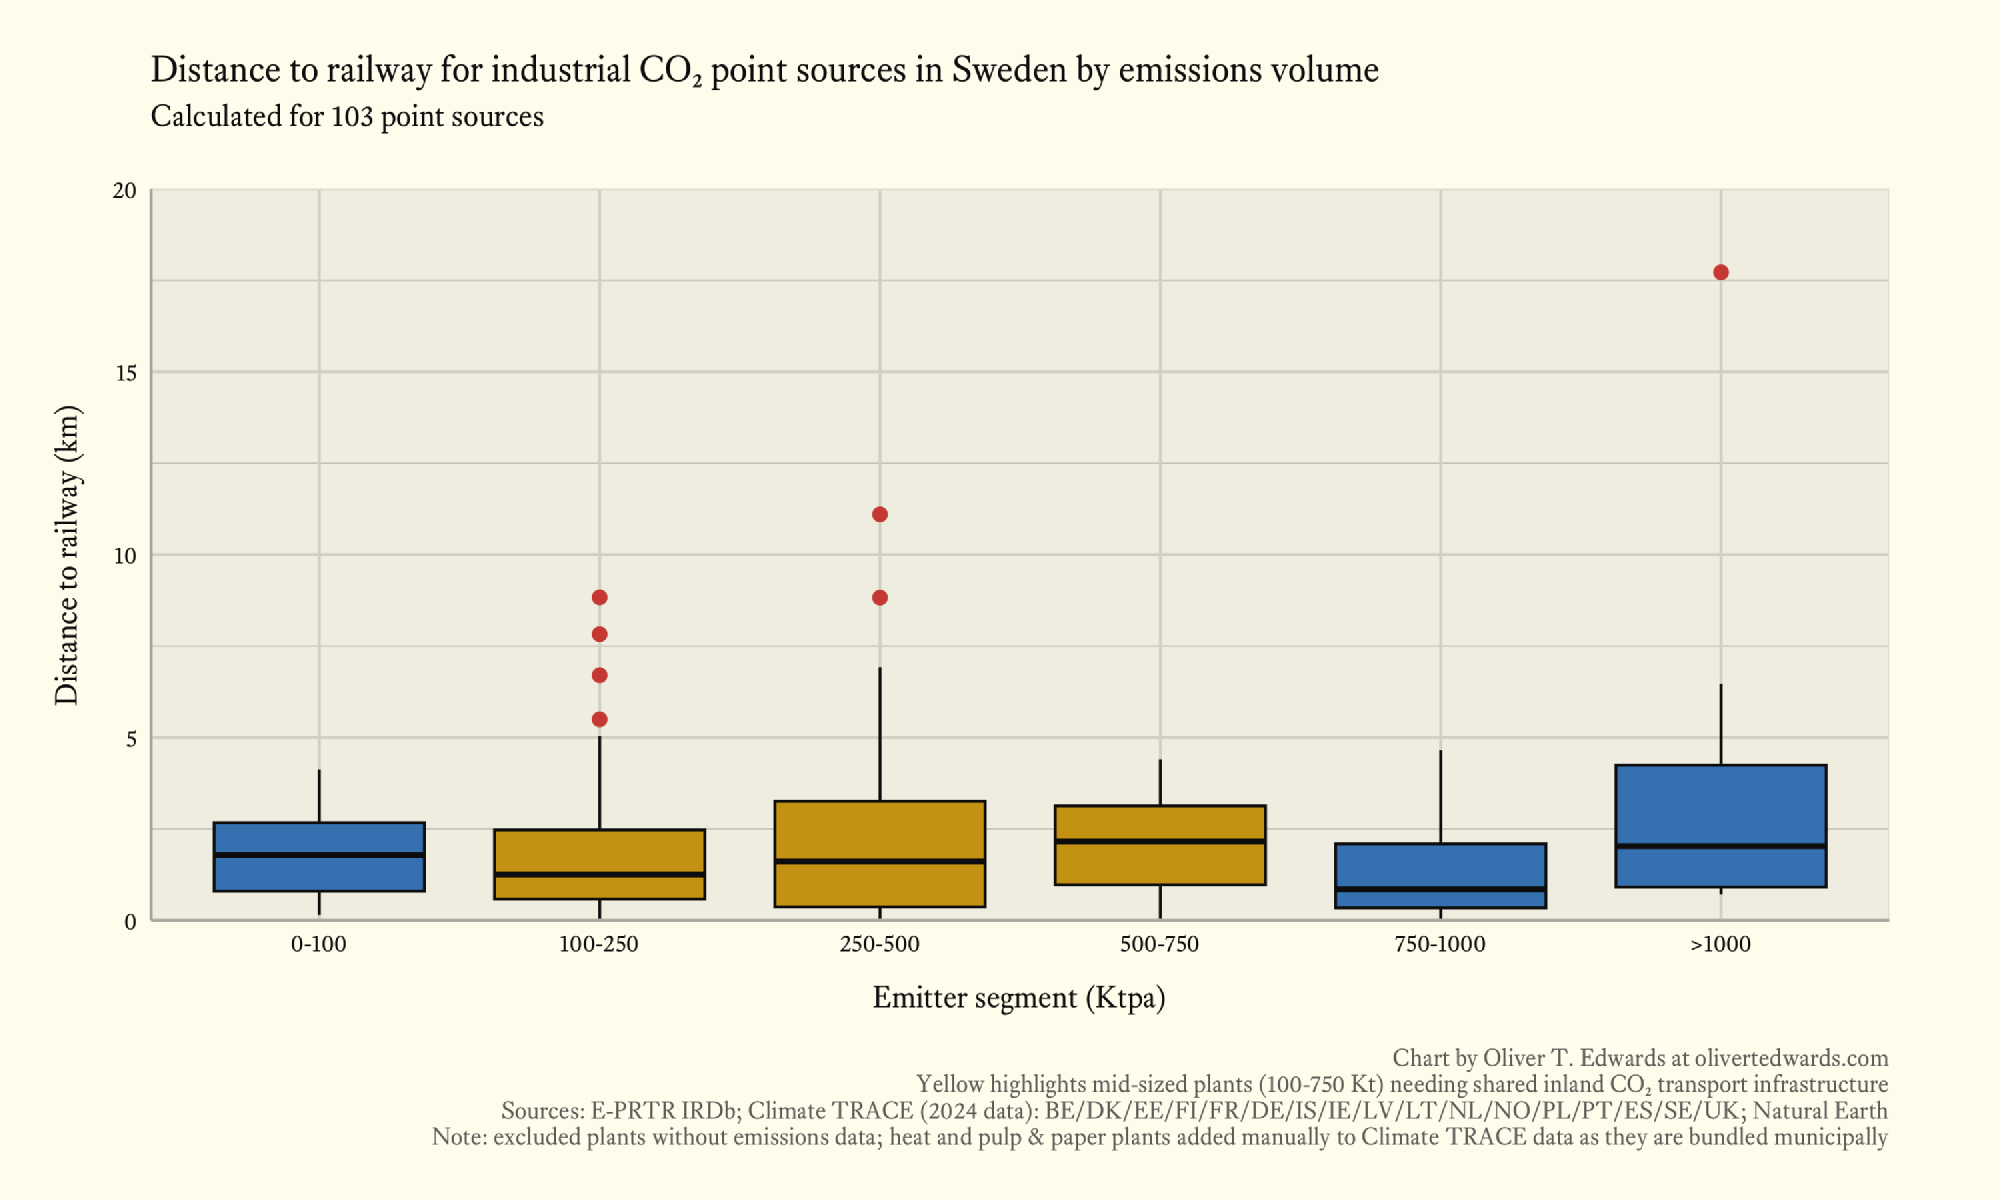
Across all segments, there is about a 3.5 km spread in point source distance to nearest railway between the lower quartile (around 0.5 km) and the upper quartile (around 4 km), with mean distances stable across all segments at roughly the 2 km mark. The short distances across the market are not surprising; Sweden relies heavily on its railway network to move both goods and passengers across regions. The key is to build well-placed CO₂ terminals at ports connecting to this railway network, while potentially taking advantage of onshore cave systems to reduce the cost of building intermittent CO₂ storage tanks before shipping volumes to the North Sea for permanent storage.
Poland
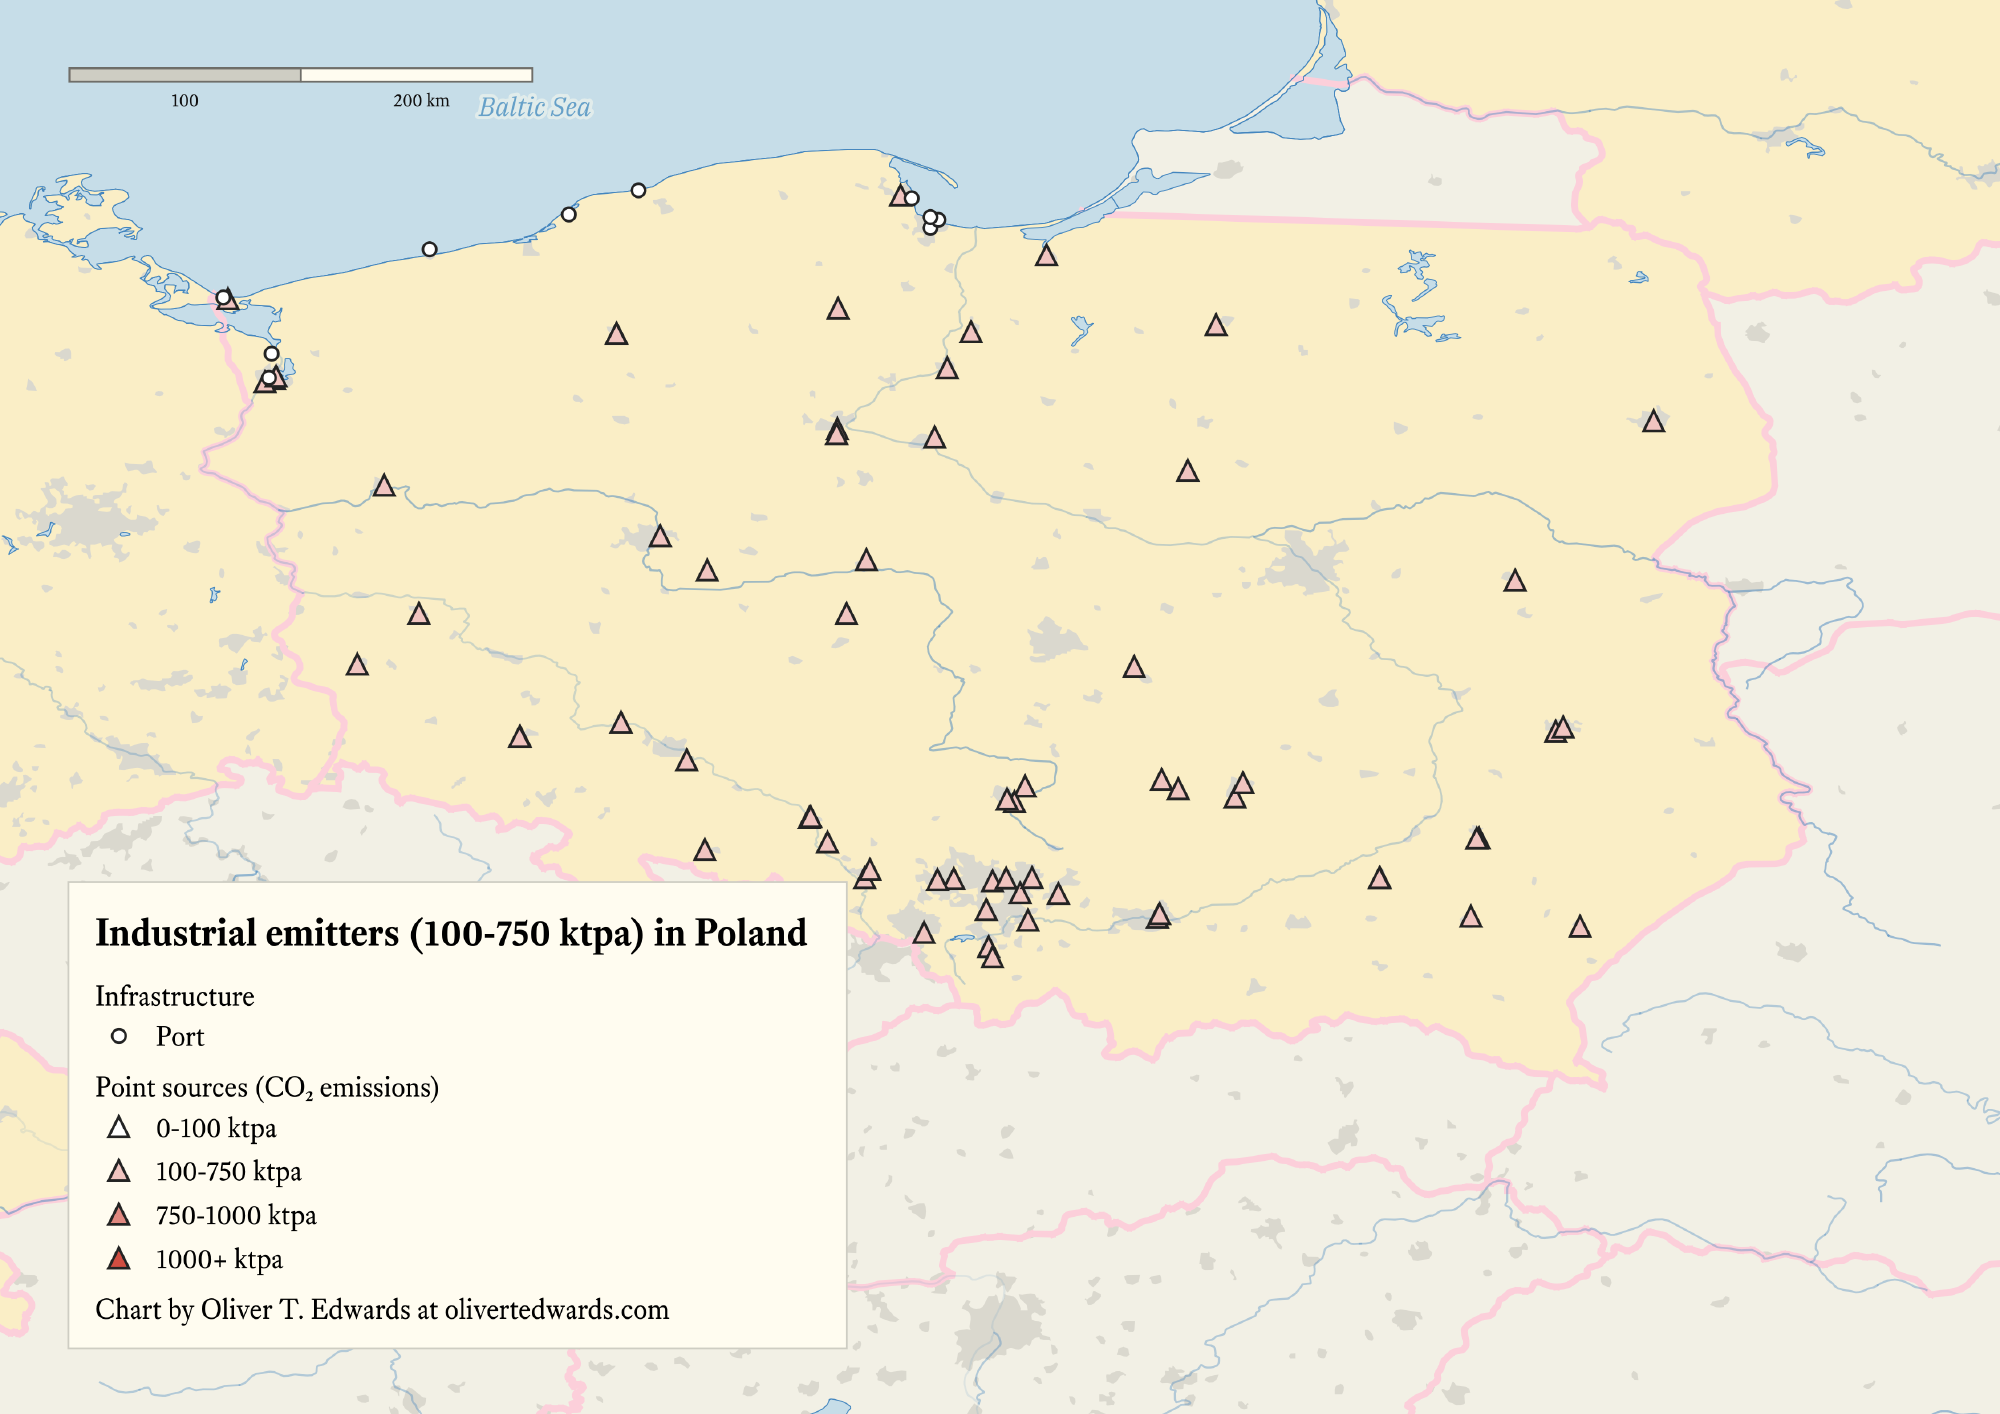
Poland’s geography sharpens every fragmentation problem. The country has just 550 km of coastline but stretches 650 km inland, with many mid-sized plants scattered across the country and some clustering around Katowice. Railways are essential to make ports accessible. There are plans to develop extensive onshore CO₂ storage and pipeline networks (Rossi2023), but these will take time to materialise. Long distances amplify the consequences of bespoke infrastructure, but dense rail networks position hubs as bridges to offshore storage, enabling coordination across all market segments.
59.4% of industrial CO₂ point sources fall in the mid-sized segment, accounting for roughly 16% of total regional emissions (25 Mtpa of 154.7 Mtpa). The market is also dominated by large emitters (>1000 ktpa) in coal and steel, but smaller industrial facilities could benefit from coordinated transport to reduce costs, especially given limited port proximity (Rossi2023). Onshore storage is in development, although if the rest of the European market is any guide, this will take longer than expected, increasing the relevance of port access in the short and medium term.

The top three CO₂ emitting sectors within the mid-sized segment are coal and lignite, other, and cement. Coal and lignite and cement are among the easier industries to decarbonise. The “other” category consists of many plants that are more difficult to address through carbon capture. However, since coal and lignite makes up 38% of the mid-sized segment—not to mention that most massive-sized emitters also come from this sector—the country should be relatively straightforward to decarbonise from a technological perspective. I’m planning a separate analysis on decarbonising countries with an overwhelming concentration of massive-sized emitters such as Poland.
| Sector | Emissions (Mtpa) | Share (%) of mid-sized segment |
|---|---|---|
| Coal and lignite | 9.6 | 38 |
| Other | 2.5 | 10 |
| Cement | 2.2 | 8 |
| Mid-sized segment total | 25 |
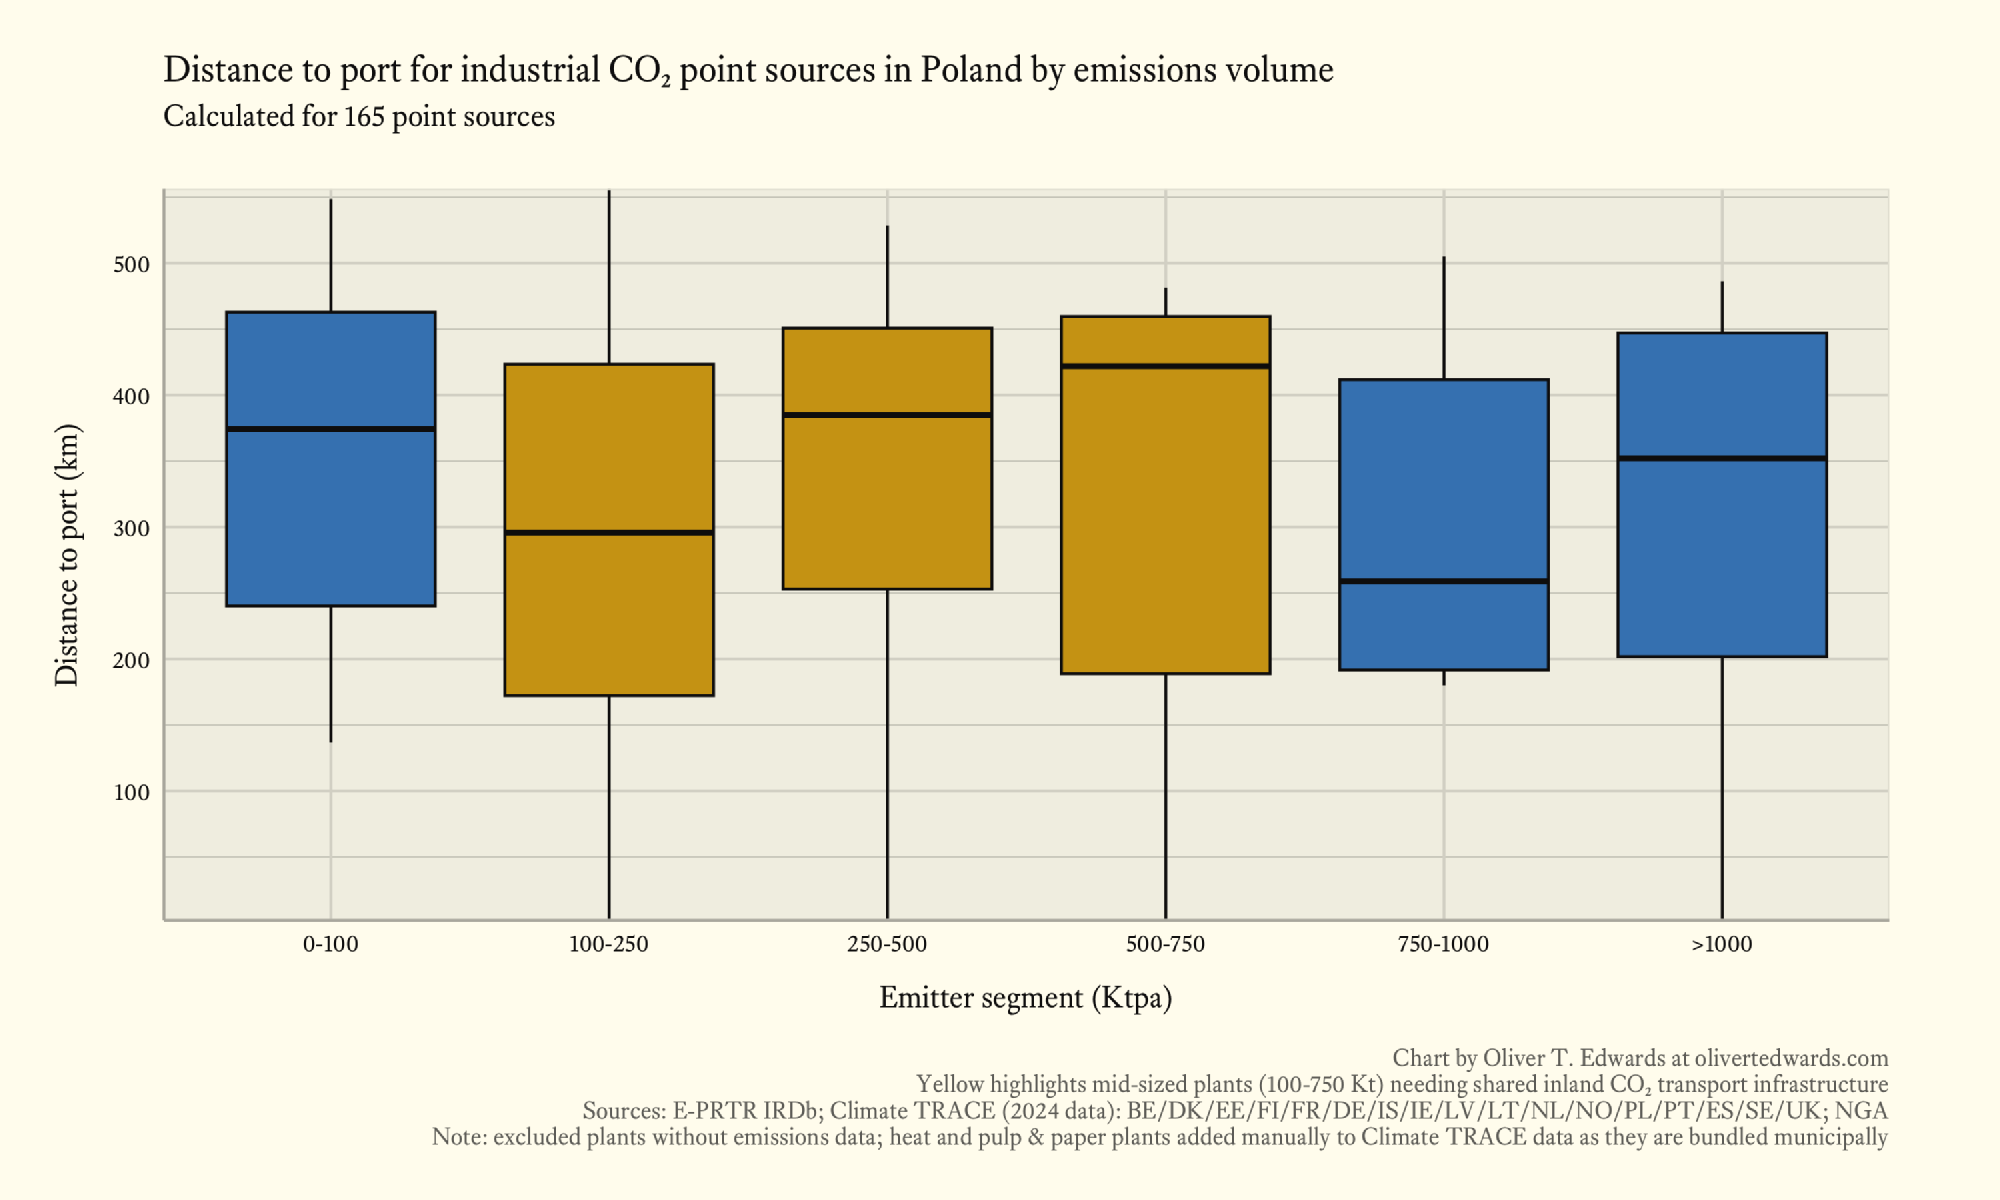
Across the mid-sized segment, there is roughly a 270 km spread in point source distance to nearest port between the lower quartile (around 180 km) and the upper quartile (around 450 km), with mean distances of 300, 380, and 460 km across the three mid-sized bands. Nearly all emitters face port distances manageable by rail, though trucking will be difficult both in terms of cost and load on the road network. Poland is also working on onshore storage to alleviate this challenge, but successful precedents in the EU remain scarce; perhaps that changes in the future. Pipelines would make considerable sense, although lead times and the difficulty of modelling future demand scenarios present a substantial challenge for implementation. Mean distance to port for emitters in the large-sized segment (750–1000 ktpa) is lower than all other segments at 250 km, while it is higher for massive-sized emitters, so coordination across the entire market is essential; especially for mid-sized emitters who face the longest distances relative to their financial capacity.
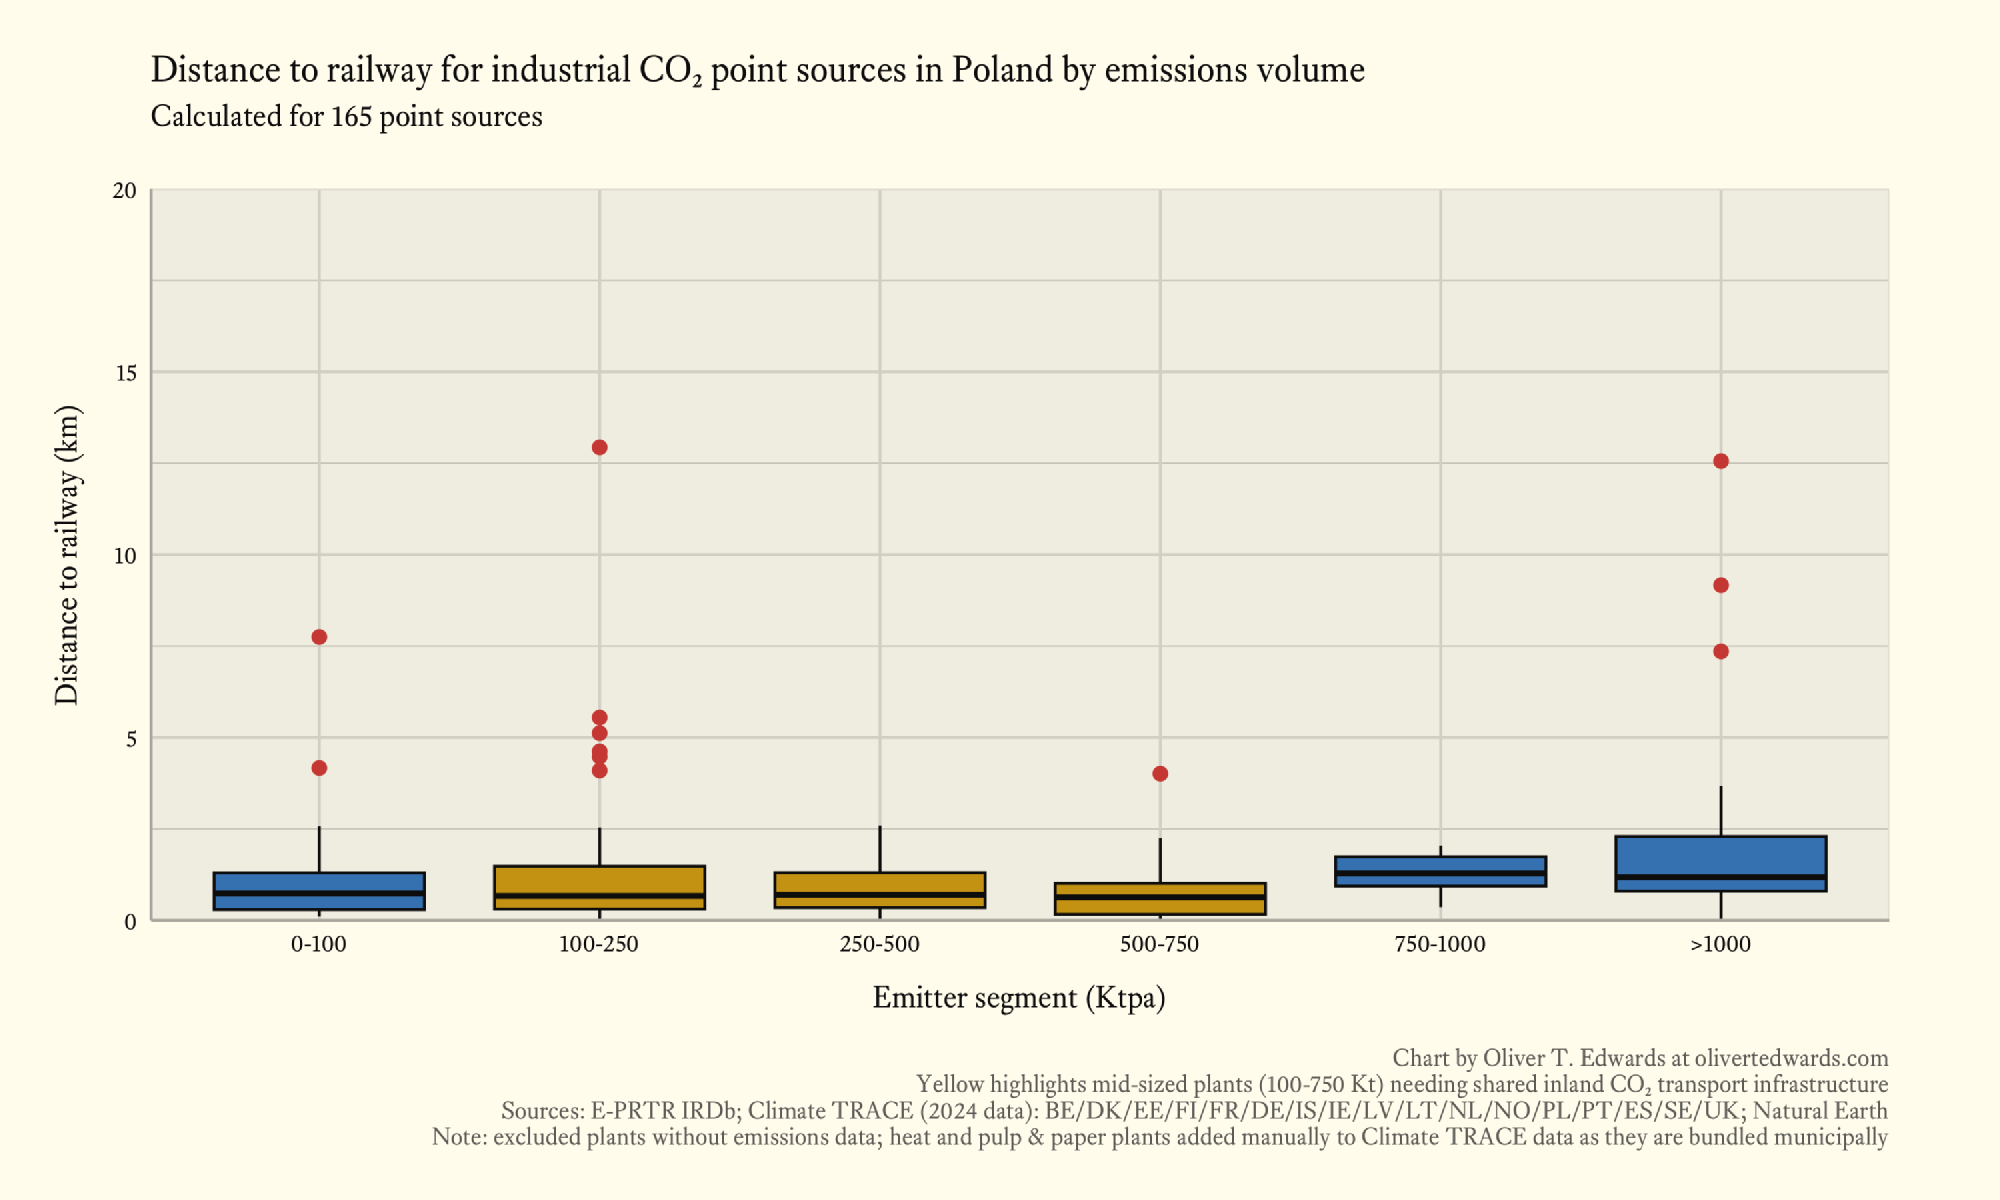
Distances to railway are very short; around 1 km for the mid-sized segment and 2 km for the 750–1000 and >1000 ktpa segments. Industrial clustering makes rail a viable option for pooling CO₂ from small and mid-sized emitters to reach ports or storage hubs while pipeline and onshore storage networks develop.
Netherlands
The Netherlands offers the closest thing to a prototype for hub potential: heavy clustering around ports enables straightforward aggregation, but without coordination, mid-sized emitters risk slipping into bespoke isolation. The delta geography positions ports as natural hubs, and the Porthos project demonstrates how bundling unlocks scale for the entire value chain.
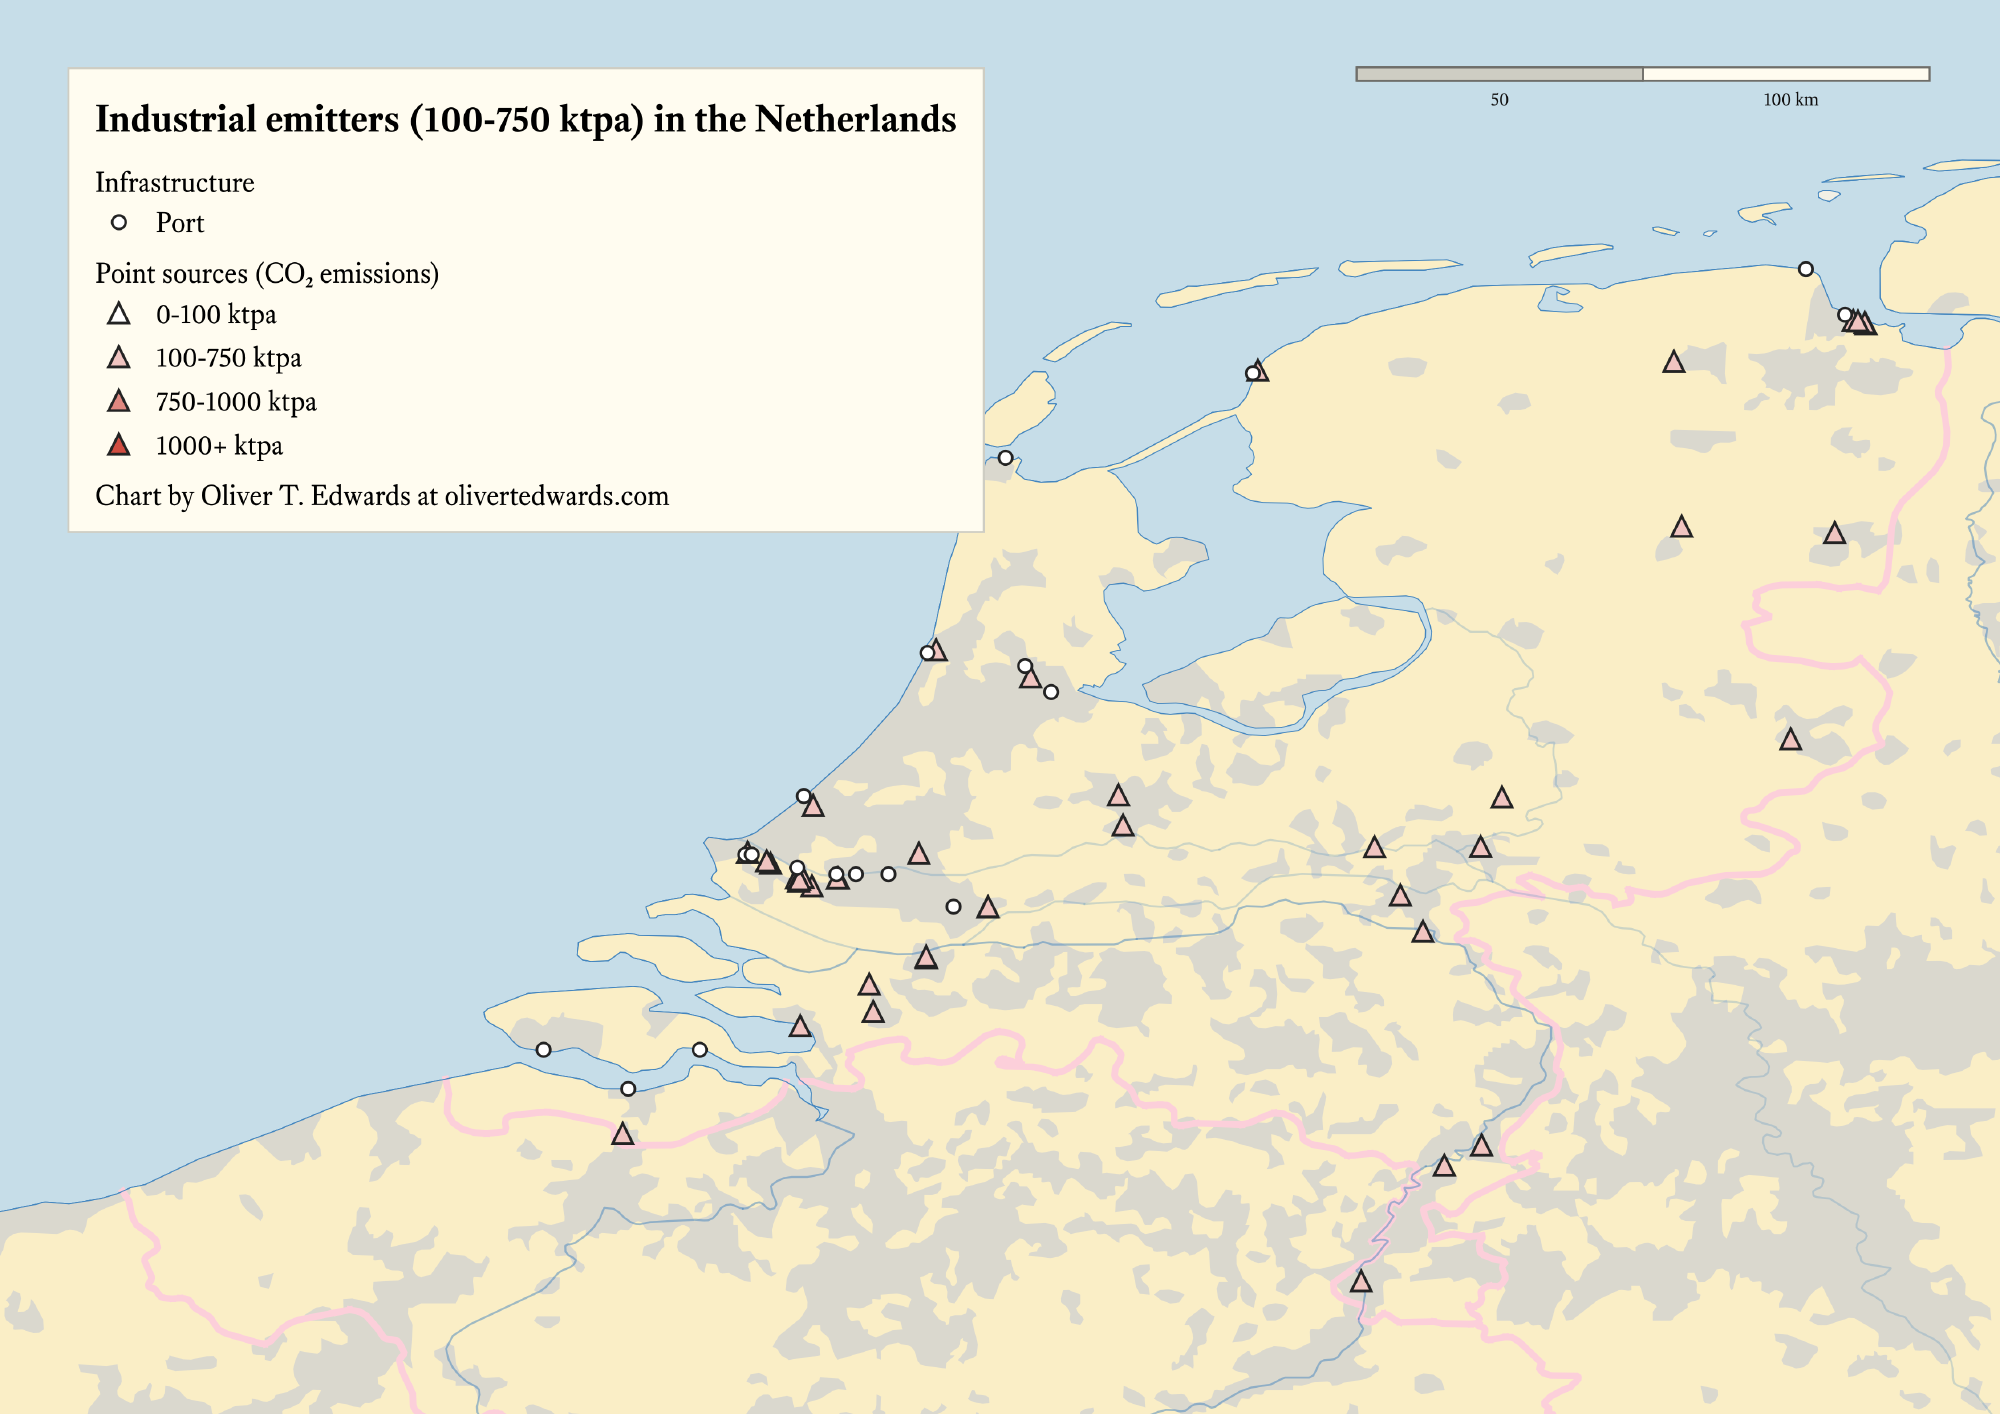
53.8% of industrial CO₂ point sources fall in the mid-sized segment, accounting for roughly 20% of total regional emissions (14.1 Mtpa of 67.6 Mtpa). A balanced mix of mid-sized and massive-sized emitters could make it easier for smaller sources to bundle with larger ones. Heavy clustering around the Rhine and Meuse deltas, which connect with Germany, creates opportunities to link with the entire industrial value chain; no wonder Porthos is well positioned.
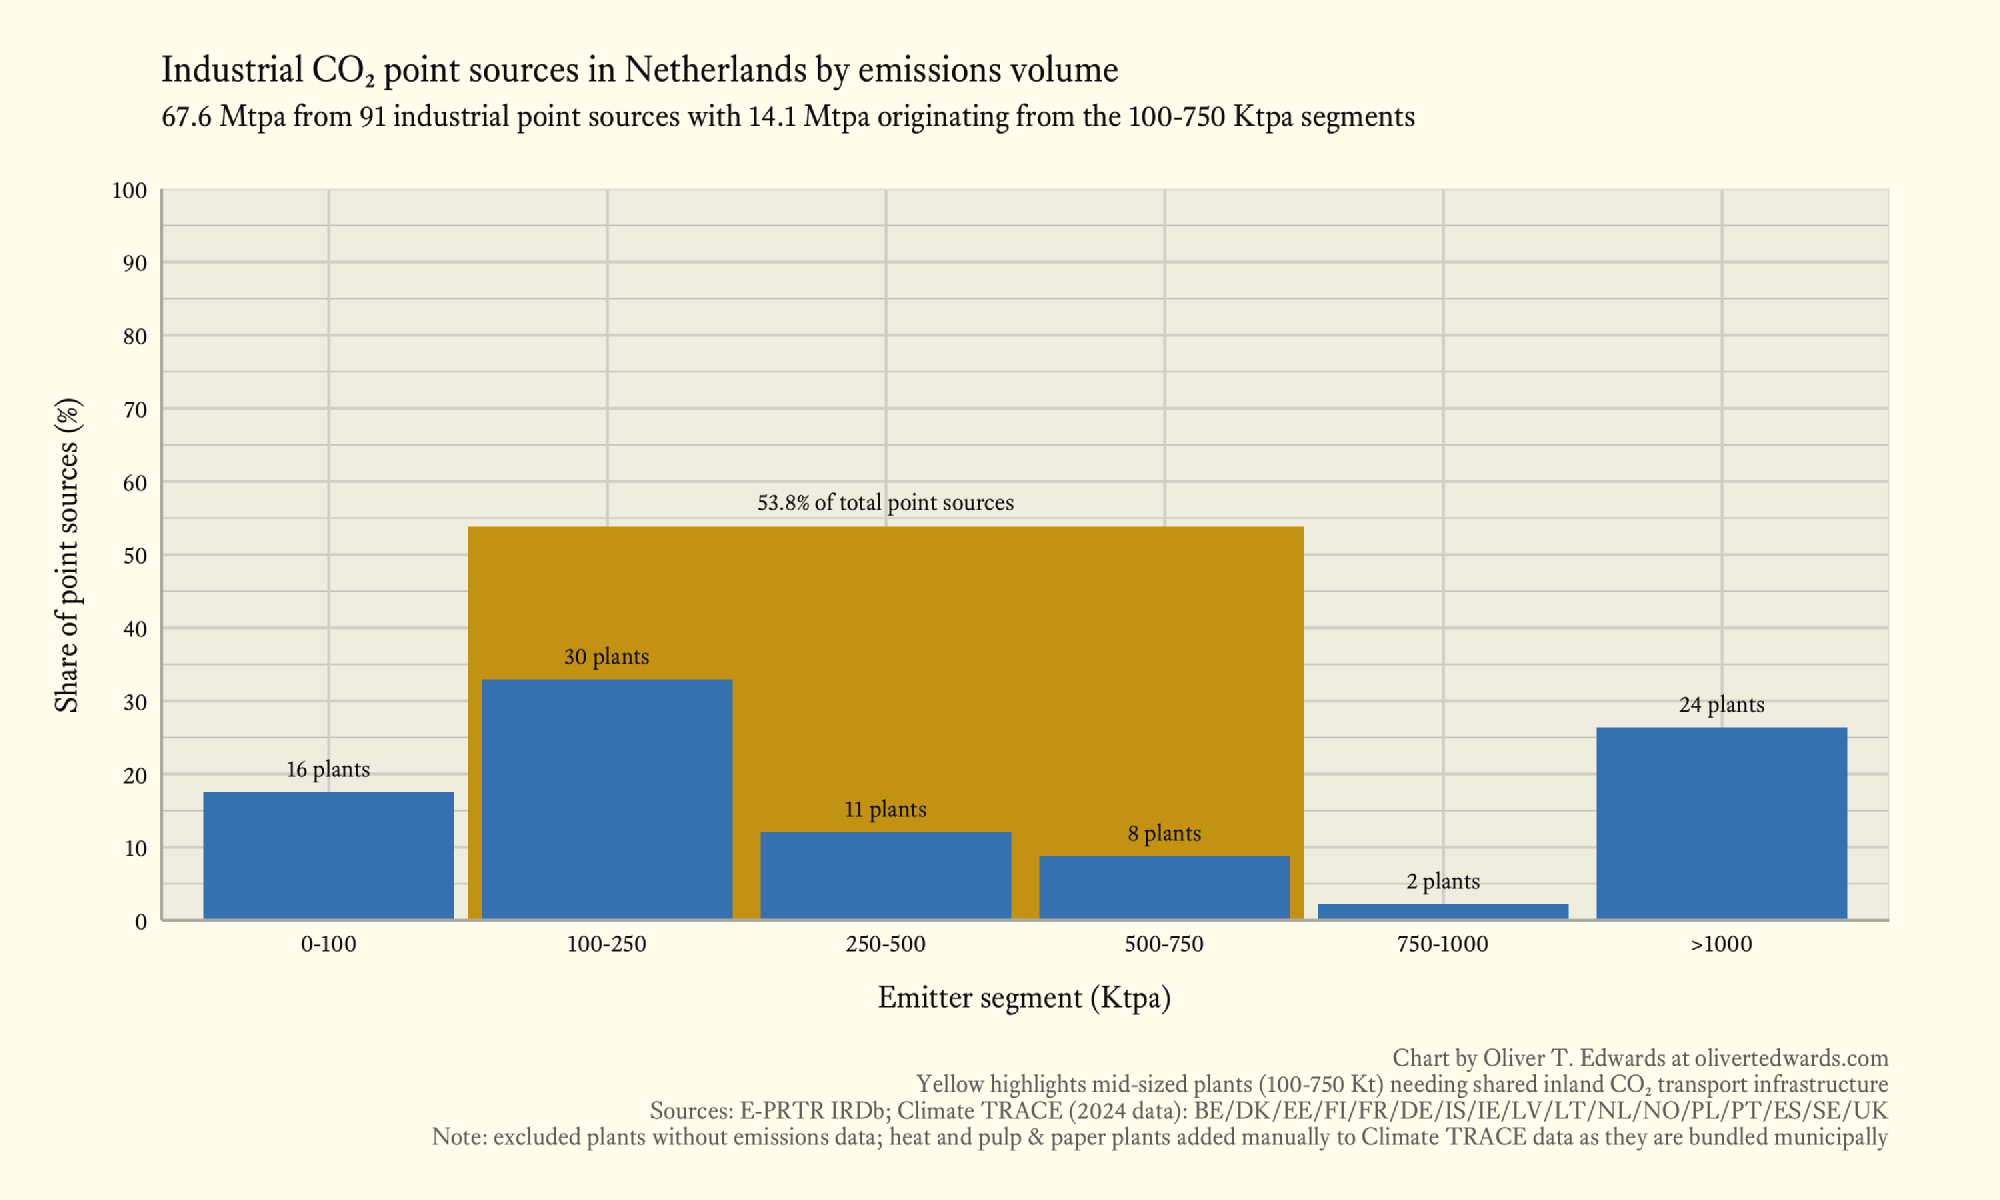
The top CO₂ emitting sectors within the mid-sized segment are natural gases and other gases, waste to energy, and refining. Waste to energy and refining are the most easily decarbonised, while natural gases and other gases represent emissions from a variety of processes including LNG terminals, where carbon capture is less straightforwardly integrated into the regional value chain. The volume of shipping around the Rhine Delta also makes it a compelling location for receiving CO₂ captured onboard merchant vessels equipped with OCCS systems.
| Sector | Emissions (Mtpa) | Share (%) of mid-sized segment |
|---|---|---|
| Natural gases and other gases | 3.8 | 26 |
| Waste to energy | 3.5 | 24 |
| Refinery | 0.8 | 5 |
| Mid-sized segment total | 14.1 |
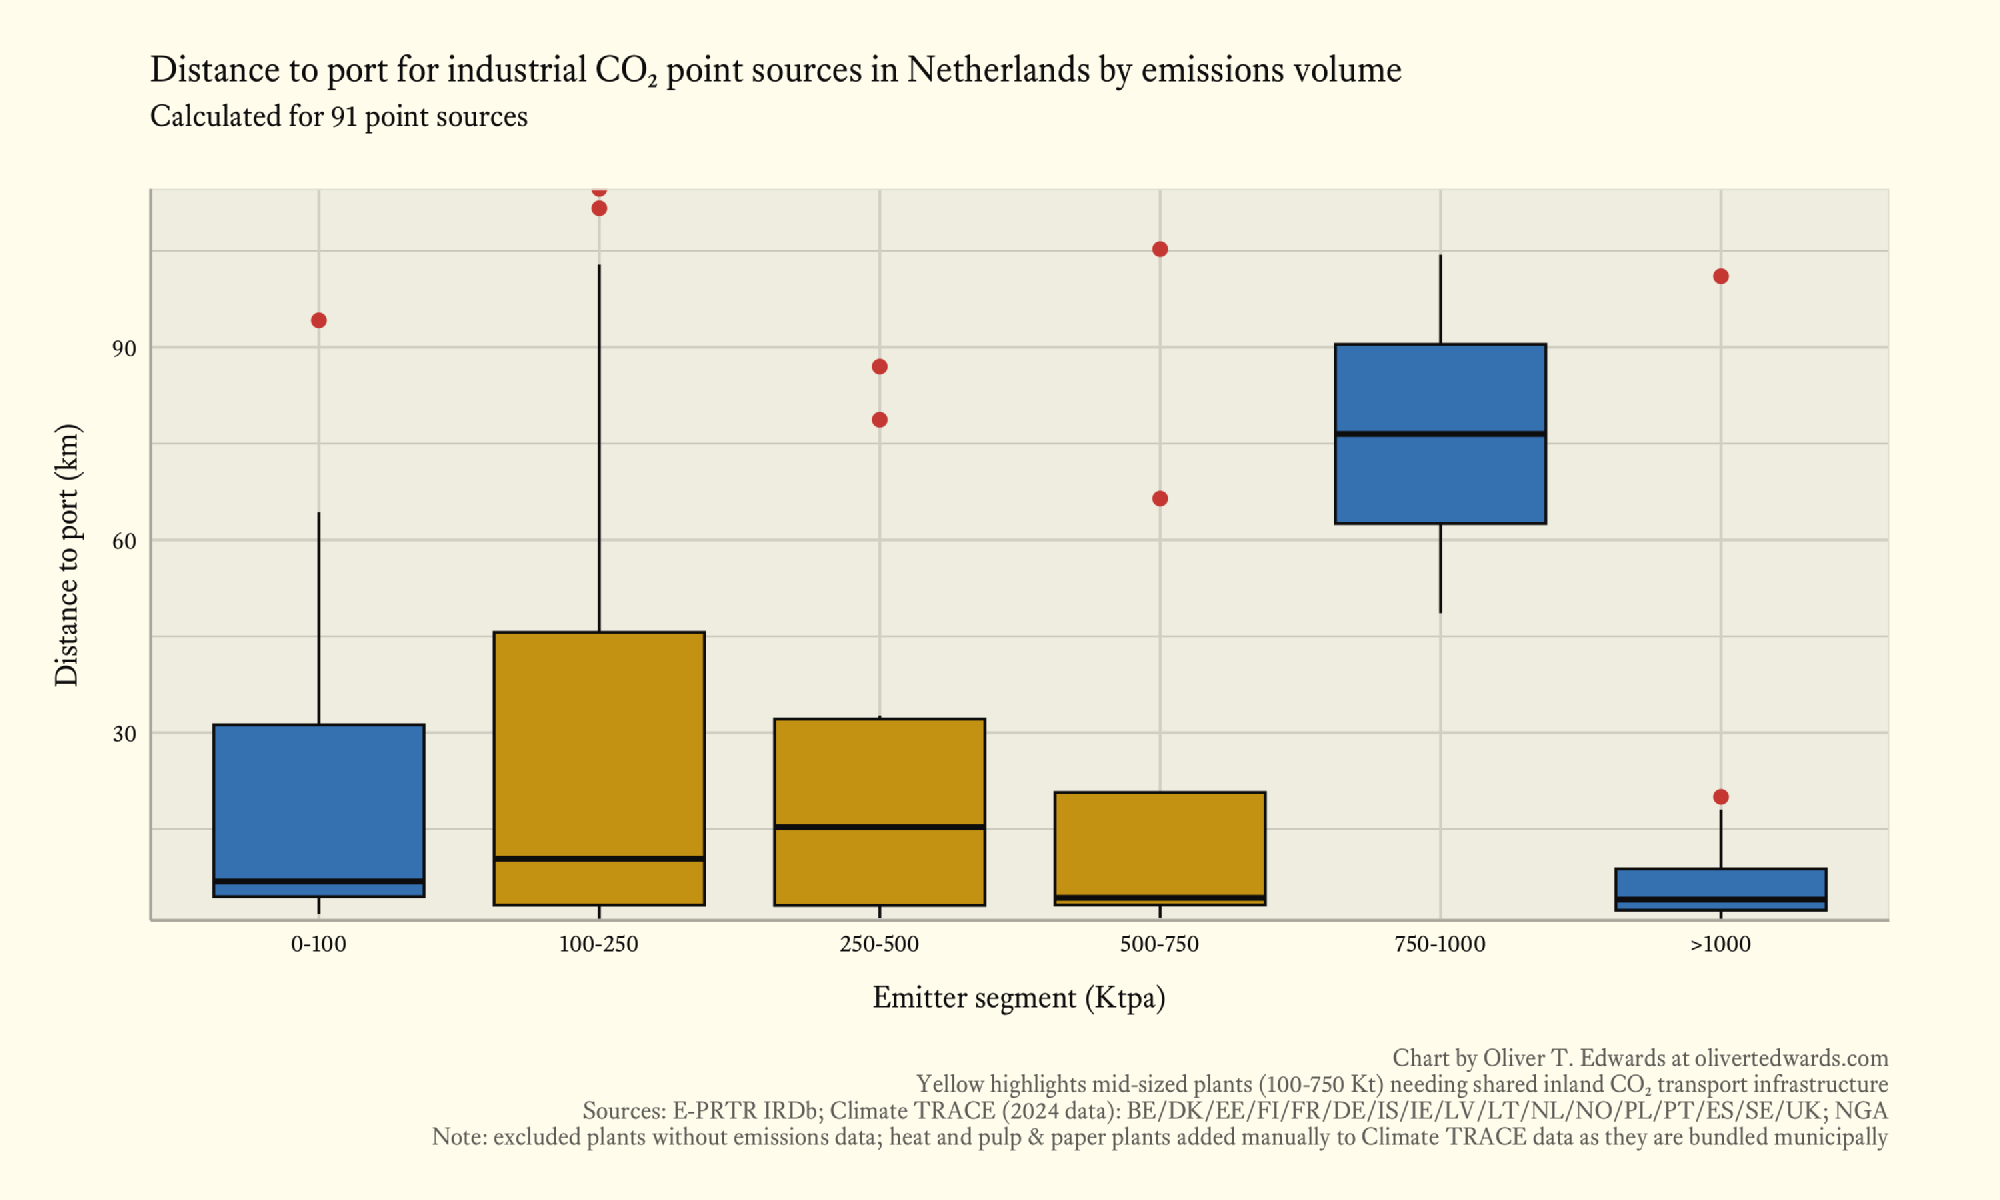
Across the mid-sized segment, there is about a 43 km spread in point source distance to nearest port between the lower quartile (around 2 km) and the upper quartile (around 45 km), with mean distances in the 10–15 km range. Massive-sized emitters sit very close to ports, easing transport logistics for the nation overall but demanding more coordination among smaller and mid-sized emitters who may not be able to bundle easily with larger players building their own transport networks. Within the mid-sized bands: mean distance to port is about 10 km for the 100–250 ktpa range, 15 km for 250–500 ktpa, and just 4 km for 500–750 ktpa. Mean distance for the large-sized segment (750–1000 ktpa) is an unusual outlier at 75 km, making an analysis of planned pipeline and railway routes all the more relevant, as they will likely pass near mid-sized emitters along the way.
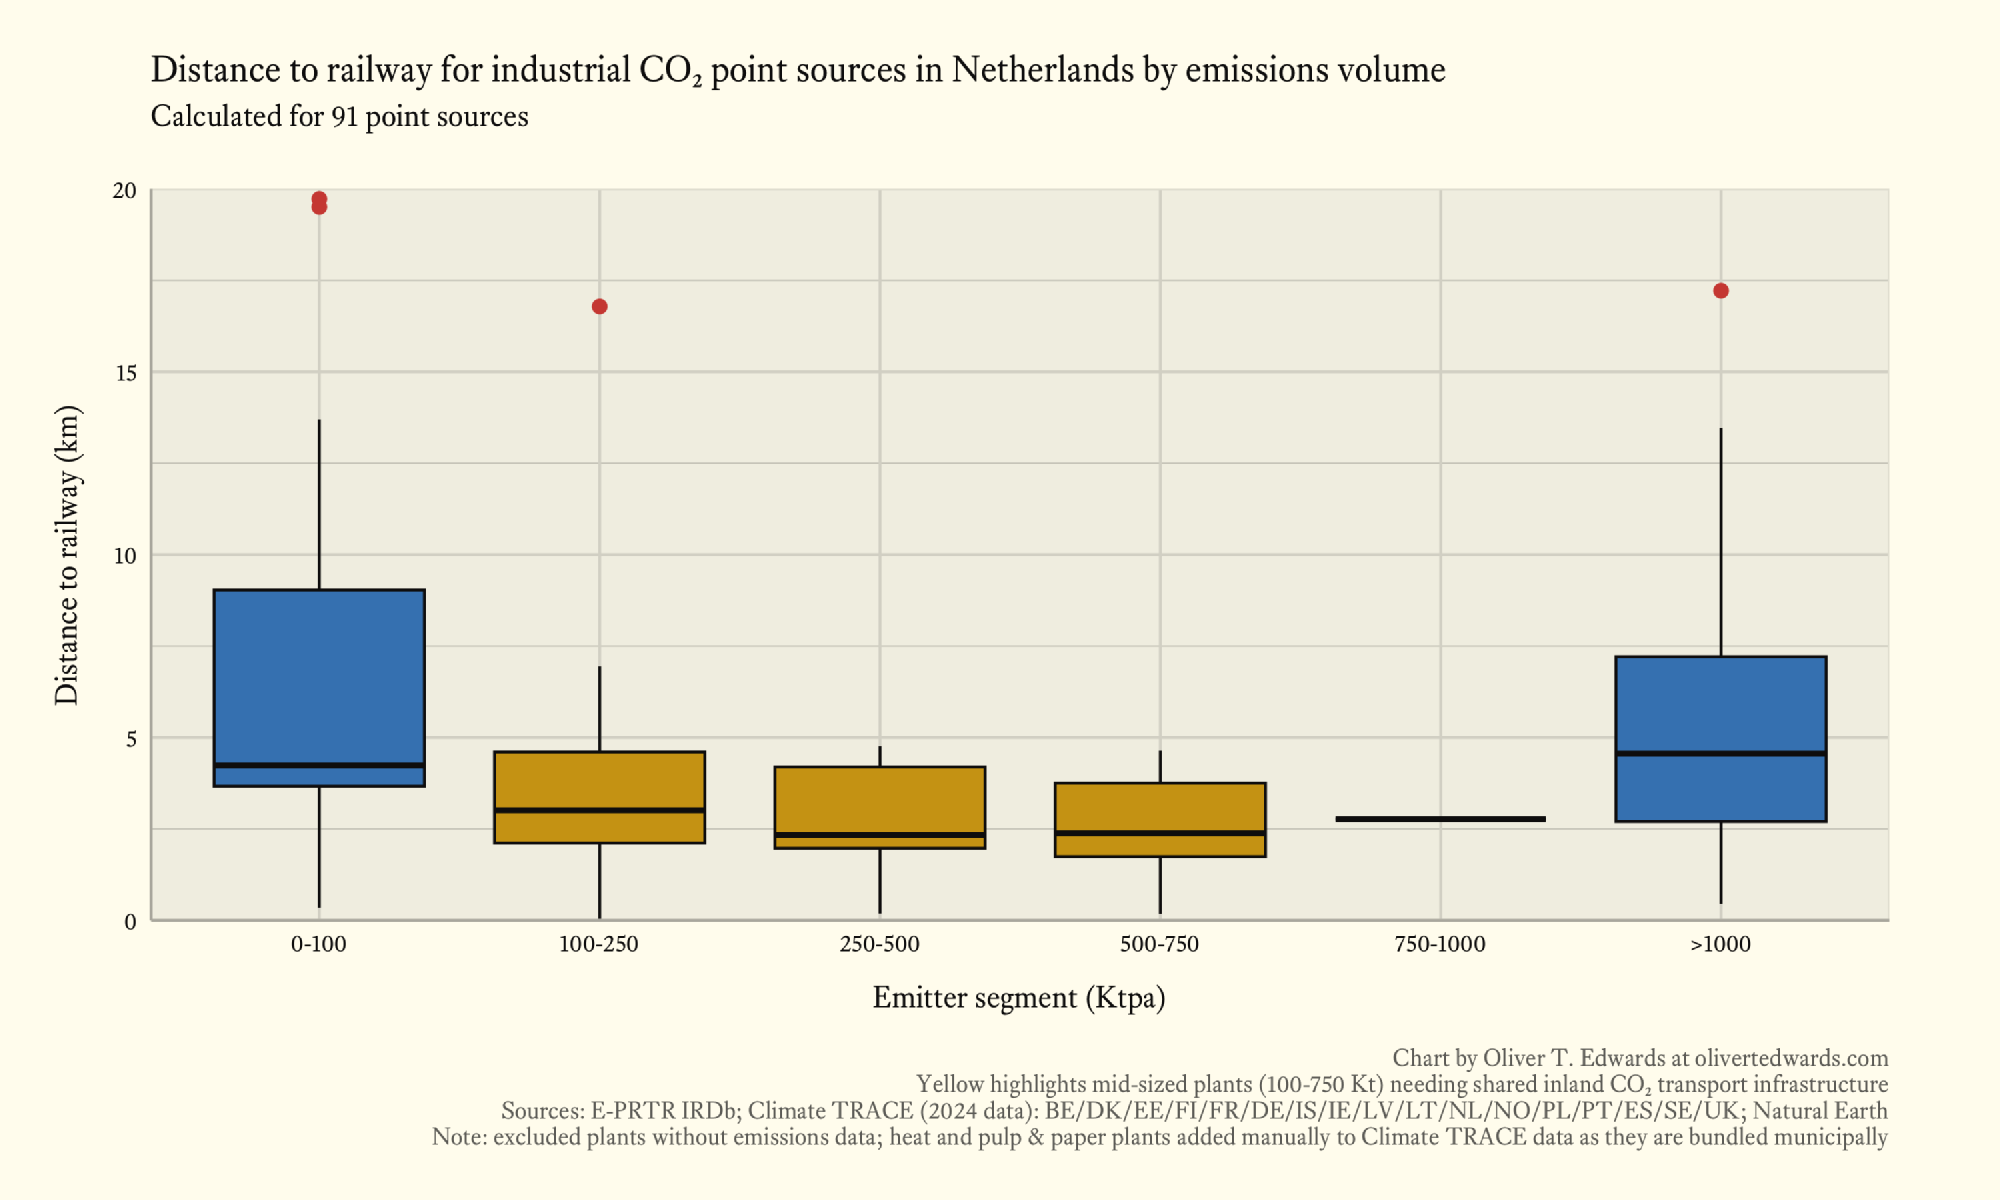
Across the mid-sized segment, distances to nearest railway are tightly clustered: about a 2 km spread between the lower quartile (around 2 km) and the upper quartile (around 4 km), with mean distances stable at roughly 2.5 km across all segments. The short distances reflect the country’s geography and dense rail networks, enabling small emitters to access shared rail transport and complementing inland waterway options for CCS; especially around Rotterdam, with its industries concentrated along the Rhine and Meuse deltas.
An interesting aside on the Dutch context: worst-case-scenario risk benchmarks from mining law increase geological storage costs significantly, much as Basel IV affects project finance more broadly. These regulations affect risk premiums and thereby the interest rates on funding for CCS projects. It is not strictly a shared-infrastructure challenge, but it illustrates how regulatory frameworks can inflate costs in ways that make scale (and the cost-sharing hubs provide) even more important. The most frustrating aspect of Basel IV in this context is that it disconnects risk scores from the actual physical risks, which are much lower than the standardised framework can accommodate.
Conclusion
Yes, I’ll admit I haven’t built a CO₂ terminal yet; very few have. But at Normod Carbon, where I’ve been working on the foundation of terminal agreements while aggregating volumes across Northern Europe, I’ve seen these patterns play out firsthand.
The LNG industry spent thirty years and billions in stranded assets learning that shared infrastructure is not a nice-to-have but a prerequisite for a functioning market. Mid-sized industrial emitters (the majority of Europe’s point sources) will be left behind if we keep defaulting to fragmented, bespoke transport thinking. At Normod Carbon, we’re modelling multi-hub configurations and piloting rail-to-port terminals in dense corridors precisely because of this.
If you’re an emitter or port operator weighing your options and sceptical about shared hubs, I’d welcome the conversation.
Methodology
Data analysis
The data for this analysis was downloaded from Climate TRACE where I’ve included emissions data from all sectors across Belgium, Denmark, Estonia, Finland, France, Germany, Iceland, Ireland, Latvia, Lithuania, Netherlands, Norway, Poland, Portugal, Spain, Sweden, and the United Kingdom. Meanwhile, I’ve used the E-PRTR IRDb and PRTR Global Map to cross-reference emissions logs, and the IEPR and E-PRTR as references for regional laws and reporting procedures.
Each sector has unique challenges when it comes to implementing carbon capture. Since the aim of this study is to facilitate industrial decarbonisation within the near to medium term, I’ve excluded sectors that are either not feasible or especially challenging to decarbonise with current technologies.
Included sectors are: fossil fuel operations (oil and gas refining), manufacturing (aluminium, cement, chemicals, iron and steel, lime, other manufacturing, other chemicals, other metals, petrochemical steam cracking, pulp and paper, wood and wood products), power (electricity generation, heat plants, other energy use), and waste (incineration and open burning of waste).
Excluded sectors are: agriculture (enteric fermentation cattle pasture, enteric fermentation cattle operation, enteric fermentation other, manure management cattle operation, manure left on pasture cattle, manure management other, manure applied to soils, crop residues, cropland fires, rice cultivation, synthetic fertiliser application, other agricultural soil emissions), mineral extraction (bauxite mining, copper mining, iron mining, rock quarrying, sand quarrying, other mining quarrying), buildings (non residential onsite fuel usage, residential onsite fuel usage, other onsite fuel usage), fluorinated gases (fluorinated gases), manufacturing (food, beverage, tobacco, glass, textiles, leather, apparel), forestry and land use (forest land clearing, forest land degradation, forest land fires, shrubgrass fires, water reservoirs, wetland fires), fossil fuel operations (coal mining, oil and gas transport, oil and gas production, other solid fuels, other fossil fuel operations), transportation (domestic aviation, domestic shipping, international aviation, international shipping, non broadcasting vessels, road transportation, railways, other transport), waste (biological treatment of solid waste and biogenic, domestic wastewater, treatment and discharge, industrial wastewater treatment and discharge, solid waste disposal).
I’ve also excluded any point sources that lack emissions data or are located offshore to ensure that mean distances to port and railway are computed accurately when analysing inland transport connectivity. Other than that, I removed heat and power plants from the Climate TRACE dataset because they bundle the emissions from these point sources under a municipal emissions figure, making it impossible to compute mean distances to port and railway. After that, I manually sorted through public records of heat and power plant emissions data, adding the point sources to my consolidated dataset.
With that, I aggregated each point source’s monthly CO₂ emissions volume into a yearly figure before segmenting each plant by total annual emissions volume into small-sized (<100 ktpa), mid-sized (100–750 ktpa), large-sized (>750-1000 ktpa), and massive-sized (>1000 ktpa) plants. Finally, I downloaded global port location data from the National Geospatial-Intelligence Agency and railway routes from Natural Earth which have been used to compute the mean distances to ports and railway lines while generating the graphs seen in this study.
-
Liquefied natural gas (LNG) is natural gas, primarily consisting of methane, cooled to about -162°C at atmospheric pressure till it occupies roughly 1/600th the volume of its gaseous form to enable efficient, long-distance transportation by sea and storage in specialised facilities. ↩︎
-
Post-WWII energy shortages in Europe and U.S. surplus production drove rapid pipeline expansions and early LNG experiments for diversified supply. ↩︎
-
Regulatory backlogs under the 1938 Natural Gas Act led to overlapping interstate/intrastate builds and frozen low prices, stranding investments (1,265 pipeline applications with only 240 approved in 1959). ↩︎
-
Shared hubs and interstate pipelines enabled economies of scale by distributing gas from southwestern hubs to multiple cities, cutting per-unit costs 20-40%. ↩︎
-
An orders of magnitude refers to the scale of numbers based on powers of ten, where each order represents a tenfold increase or decrease. For example, if a number is ten times larger than another, it differs by one order of magnitude. ↩︎
-
Economies of scale represent the potential benefits of having a larger operation. In theory, larger operations are able to increase production, buy higher quantities of goods in bulk, and rely on process efficiencies. When these benefits are captured, it is said that a company is capitalising on economies of scale as it is accomplishing more efficient use of resources due to its size. ↩︎
-
Carbon capture and storage (CCS) comprises technologies to separate carbon dioxide (CO₂) from flue gases at large point sources such as power plants and industrial facilities, compress it for transport via pipelines or ships, and inject it into deep subsurface geological formations like saline aquifers or depleted hydrocarbon reservoirs for indefinite isolation from the atmosphere. ↩︎
-
Rough calculation based on the data from this study with 2092 point sources where 1626 have annual emissions between 0 and 500 ktpa. ↩︎
-
Northern Lights is a joint venture between Equinor, Shell, and TotalEnergies, providing CO₂ transport and storage as a service to emitters. ↩︎
-
Megatonnes per annum (mtpa) is a measurement indicating one million metric tonnes produced annually. ↩︎
Bibliography
-
Stopford2008 “Maritime Economics”, Routledge
The standard reference text for maritime economics, covering shipping market cycles from 1741 to the early 2000s, the mechanics of supply, demand, and freight rate formation across tanker, bulk, container, and specialist markets, and the financial architecture of ship ownership including costs, revenue, and risk management. Stopford’s framework for understanding how shipping markets work — the interplay of slow-moving supply (new vessel orders take years to deliver) and volatile demand — is directly applicable to CO₂ shipping, where the market is building from scratch and capital commitments for purpose-built carriers must be made years before the cargo volumes they depend on have been contracted.
-
Rossi2023 “Carbon Capture and Storage Deployment in Europe”, Clean Air Task Force
Clean Air Task Force country-level analysis documenting CCS deployment opportunities, storage landscapes, and industrial decarbonisation strategies across Europe. The fact sheets map capture potential by sector and country against available storage options, with particular attention to the gap between the ~600 Mtpa of permanent storage the EU will need by 2050 and the project pipeline currently under development. The analysis is most useful as a diagnosis of why CCS readiness varies so sharply across Europe — some countries have clear pathways and others are still resolving basic questions about storage geology and regulatory frameworks.
-
Rodrigue2024 “The Geography of Transport Systems”, Routledge
The standard academic reference for transport geography, covering the physical, economic, and spatial dimensions of freight and passenger mobility across all modes; maritime, rail, road, and air. The fifth edition provides the conceptual and quantitative framework for understanding how transport systems create and distribute economic value, including the cost structures and modal economics that govern logistics decision-making. The aggregated logistics cost data cited in this blog (roughly 75% trucking, 15% maritime, 5% air, 5% rail) comes from this text, and the broader framework is essential for anyone modelling transport cost structures across modes and distances.